In this study, the authors conducted an in-depth and comprehensive bioinformatics analysis of the expression of CXC chemokines in Renal cell carcinoma and evaluated their potential as therapeutic targets and prognostic biomarkers based on several large public databases.
Herein, I will recover all figures for this paper step by step.
In Brief for this paper
-
Publication
-
Keywords
- Sixteen CXC chemokines (not including CXCL15)
- CXCL1, CXCL2, CXCL3, CXCL4, CXCL5, CXCL6, CXCL7, CXCL8, CXCL9, CXCL10, CXCL11, CXCL12, CXCL13, CXCL14, CXCL16, CXCL17
- Renal cell carcinoma(RCC), Kidney cancer
- Sixteen CXC chemokines (not including CXCL15)
-
Methods
ONCOMINEGEPIAUALCANcBioPortalGeneMANIADAVID 6.8MetascapeTRRUSTLinkedOmicsTIMER
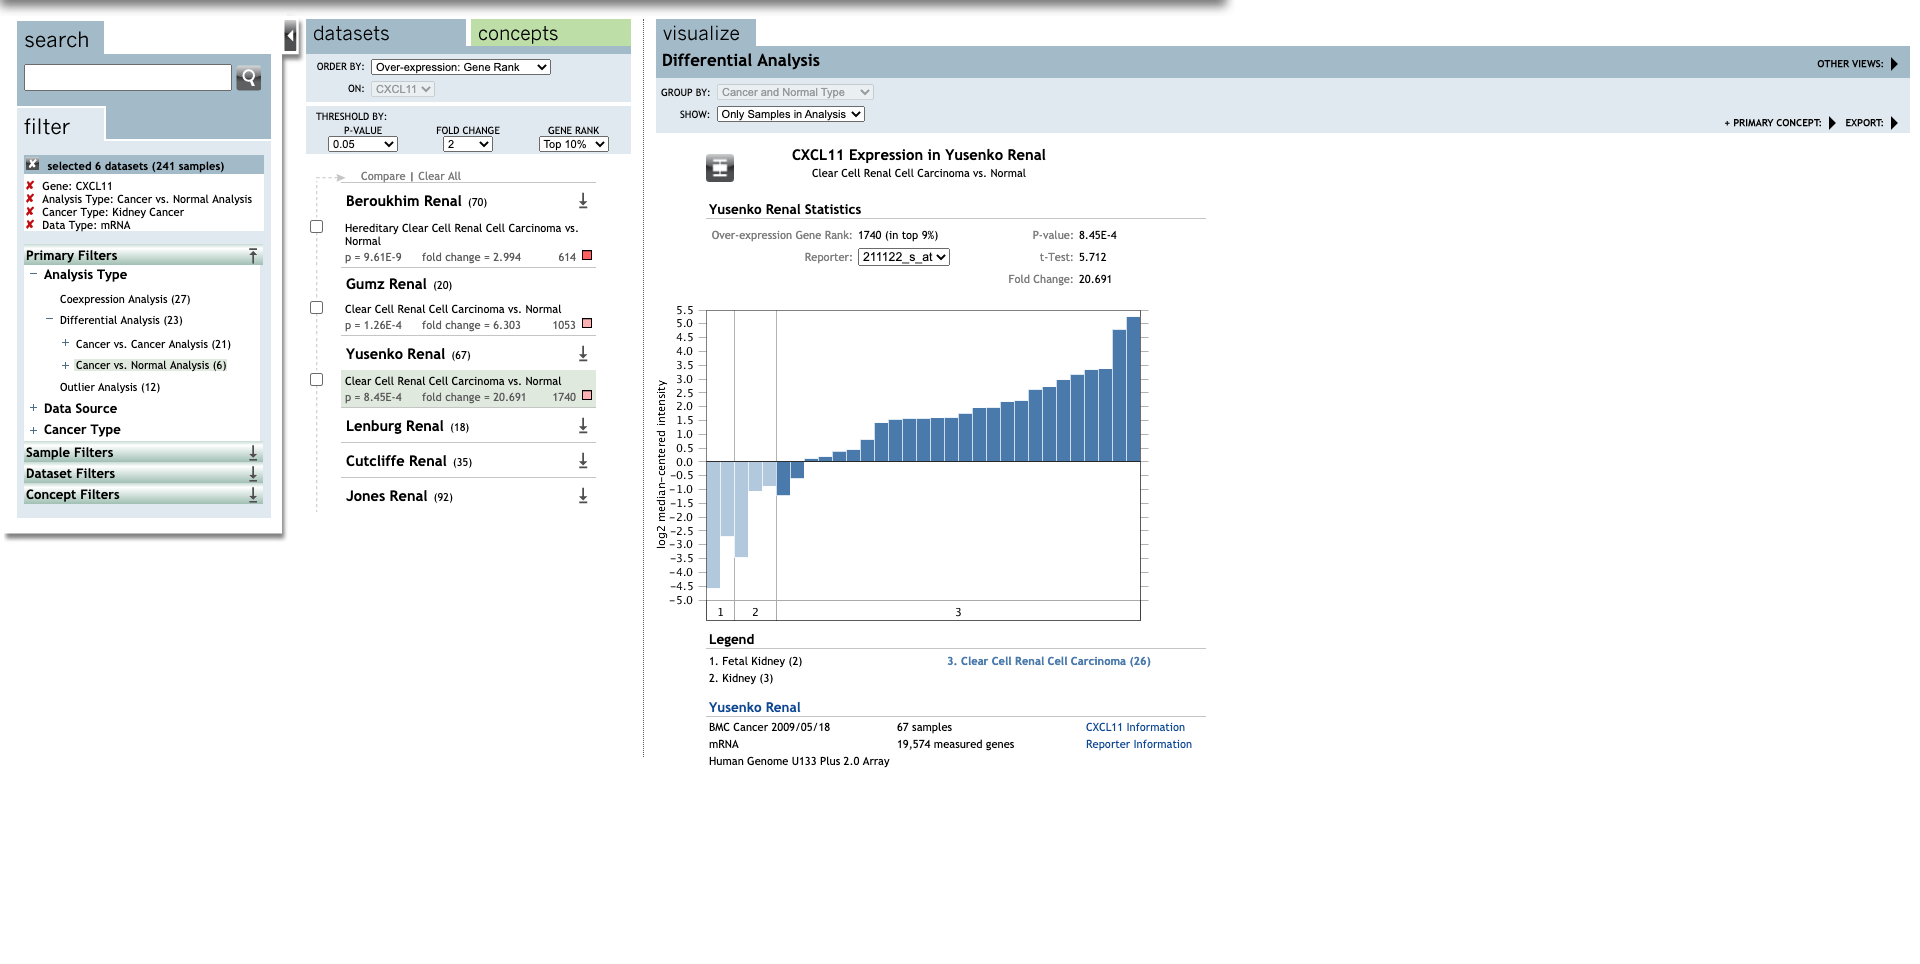
Figure 1. mRNA levels of CXC chemokines in RCC (ONCOMINE)
-
Methods: ONCOMINE.
-
Open Oncomine database
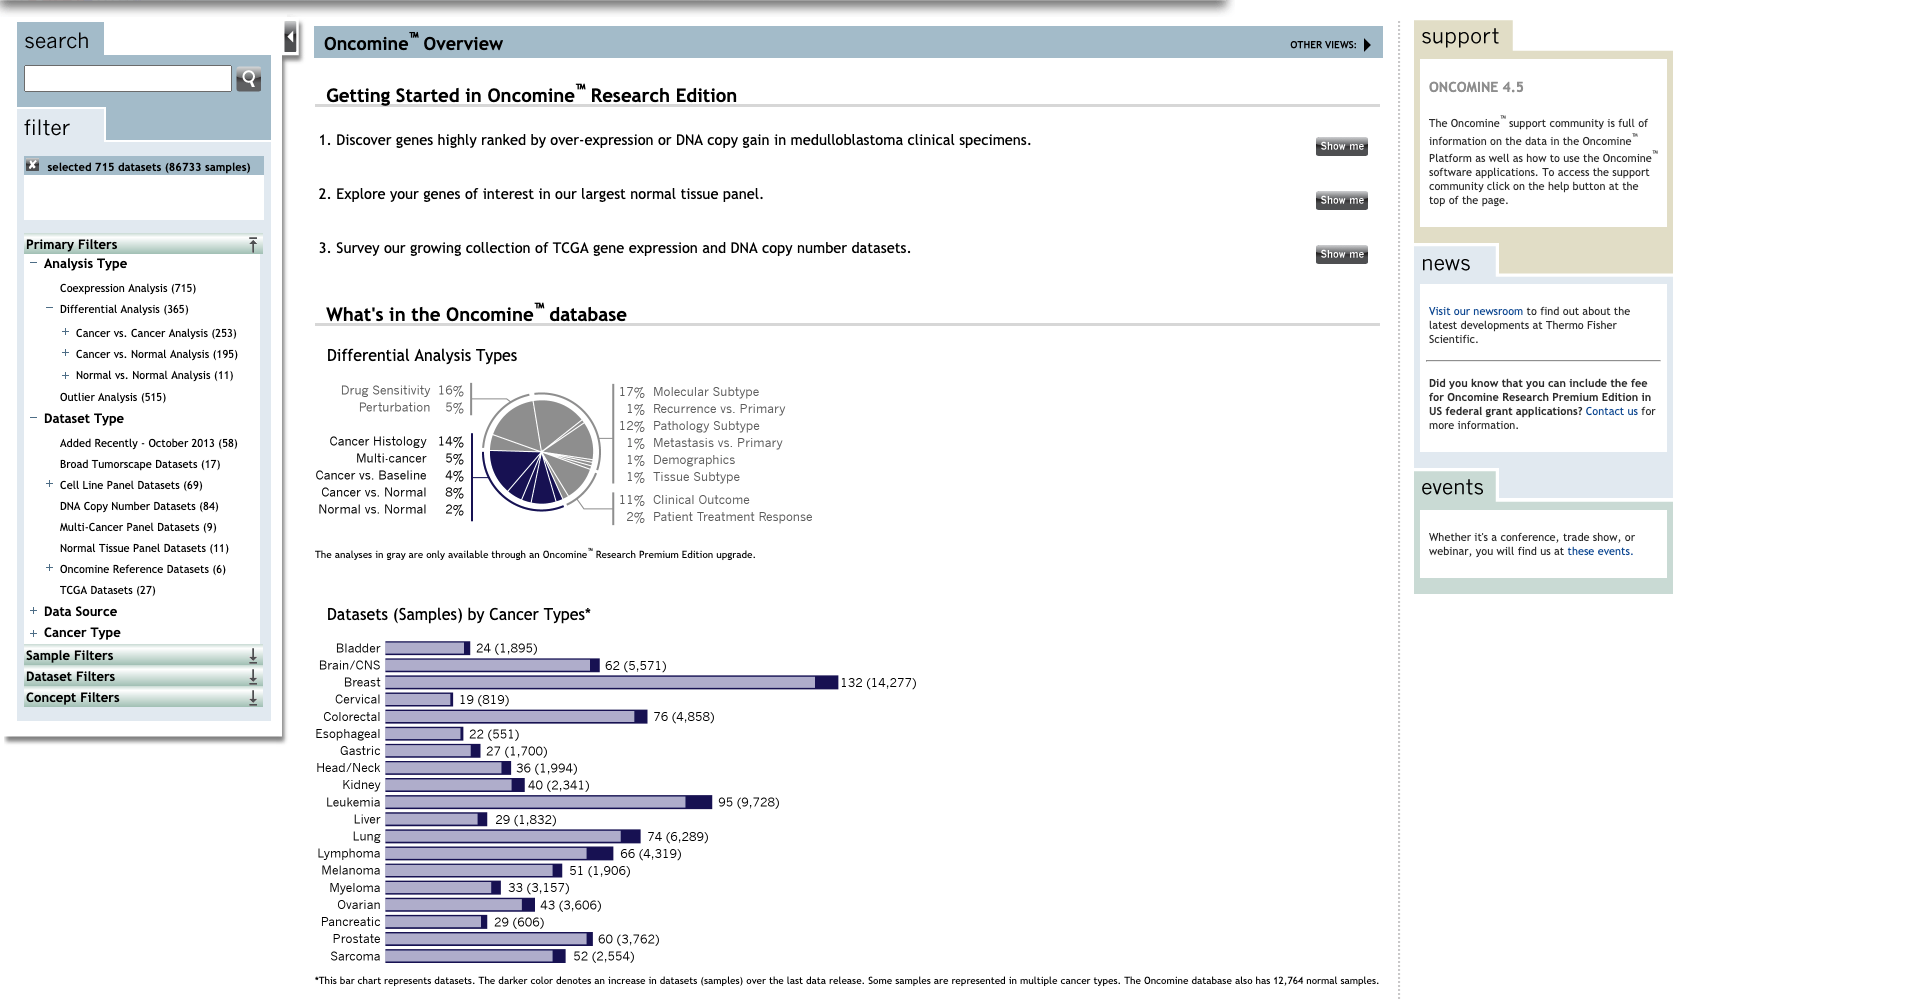
-
Set up the parameters for CXCL1
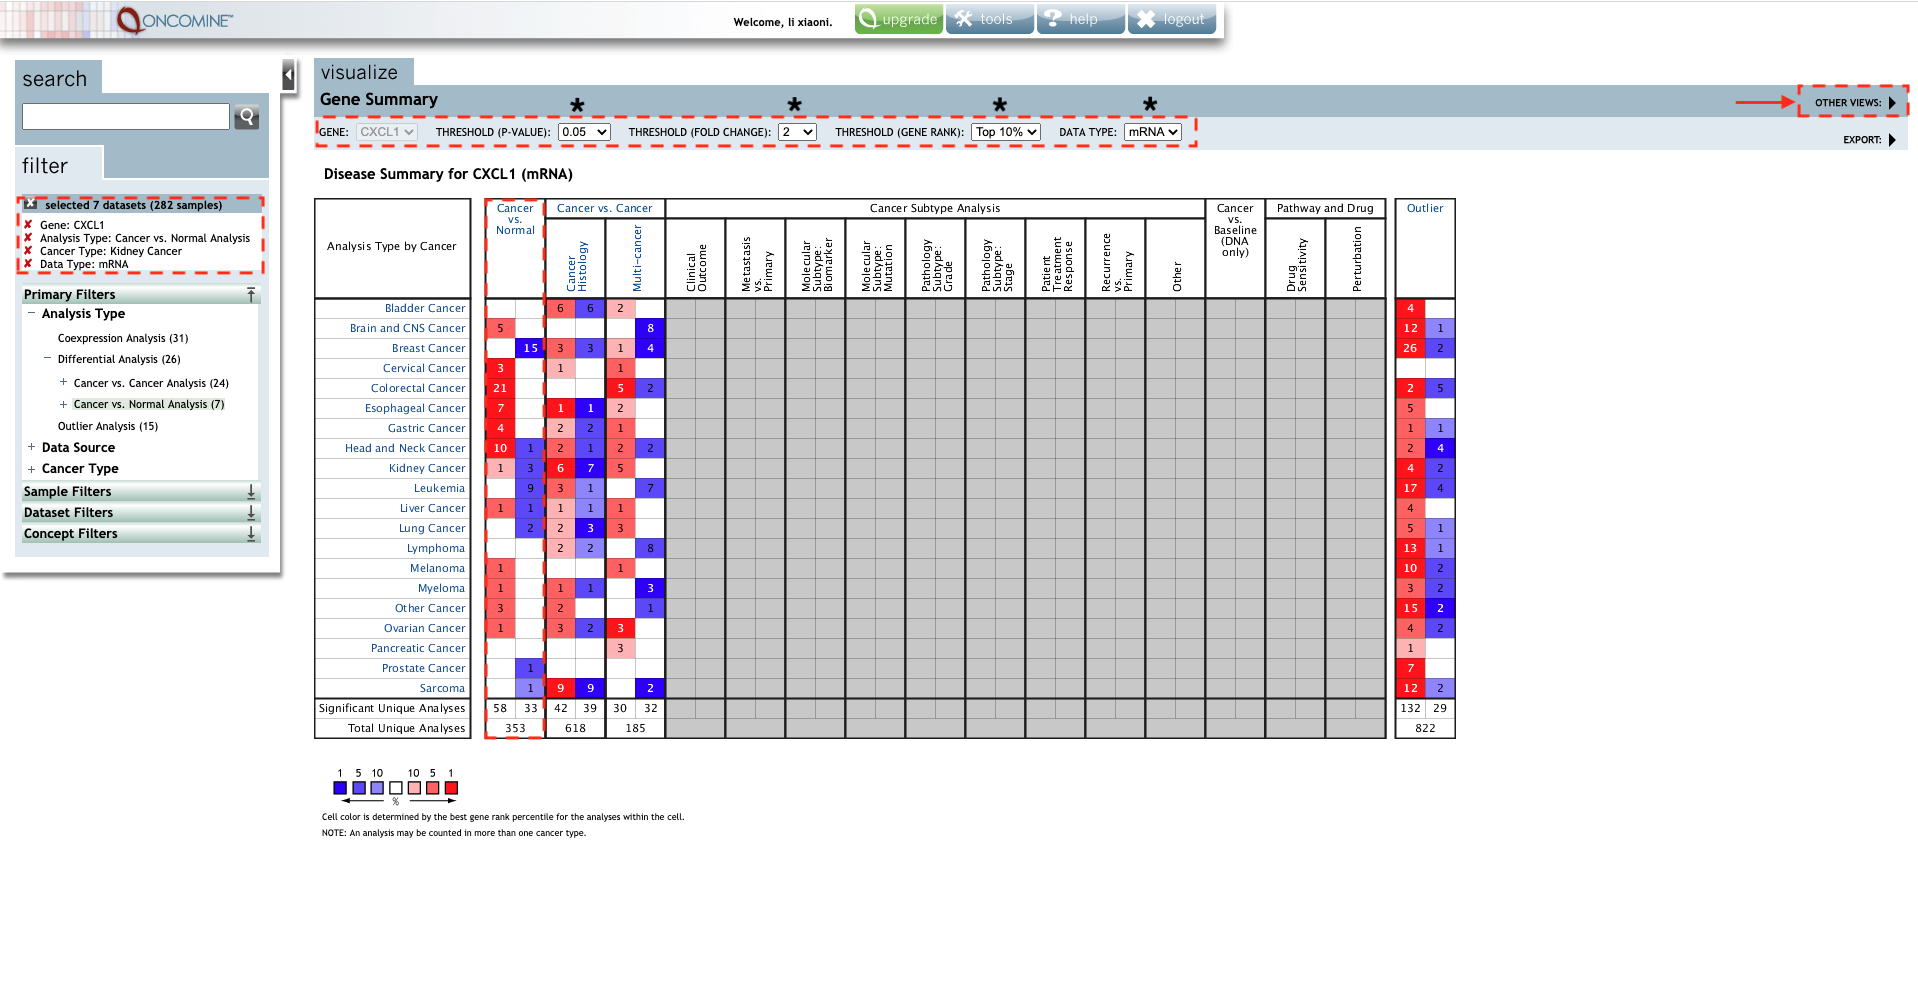
-
Merge all CXC chemokines together with Google Slides
- Red: the numbers of datasets with statistically significant mRNA over-expression (red)
- Blue: downregulated expression of CXC chemokines.
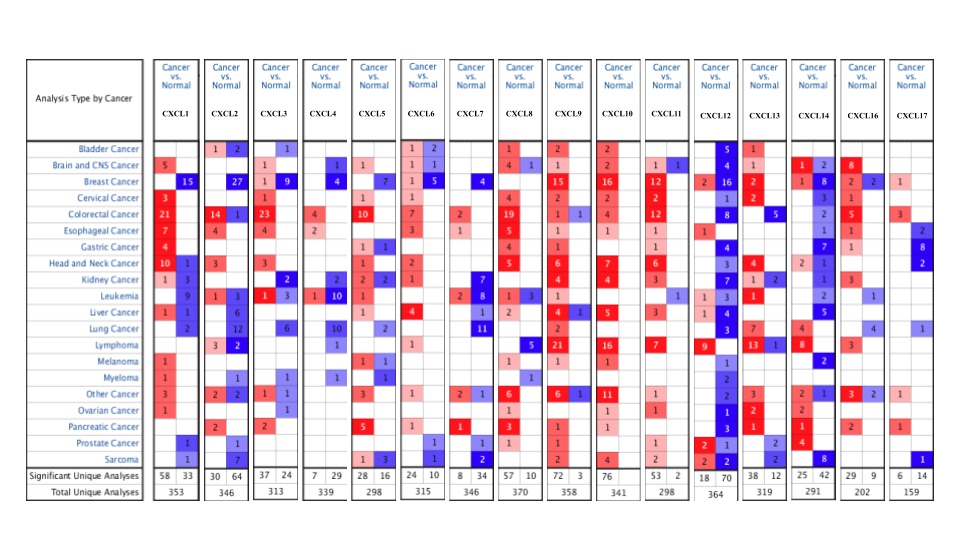
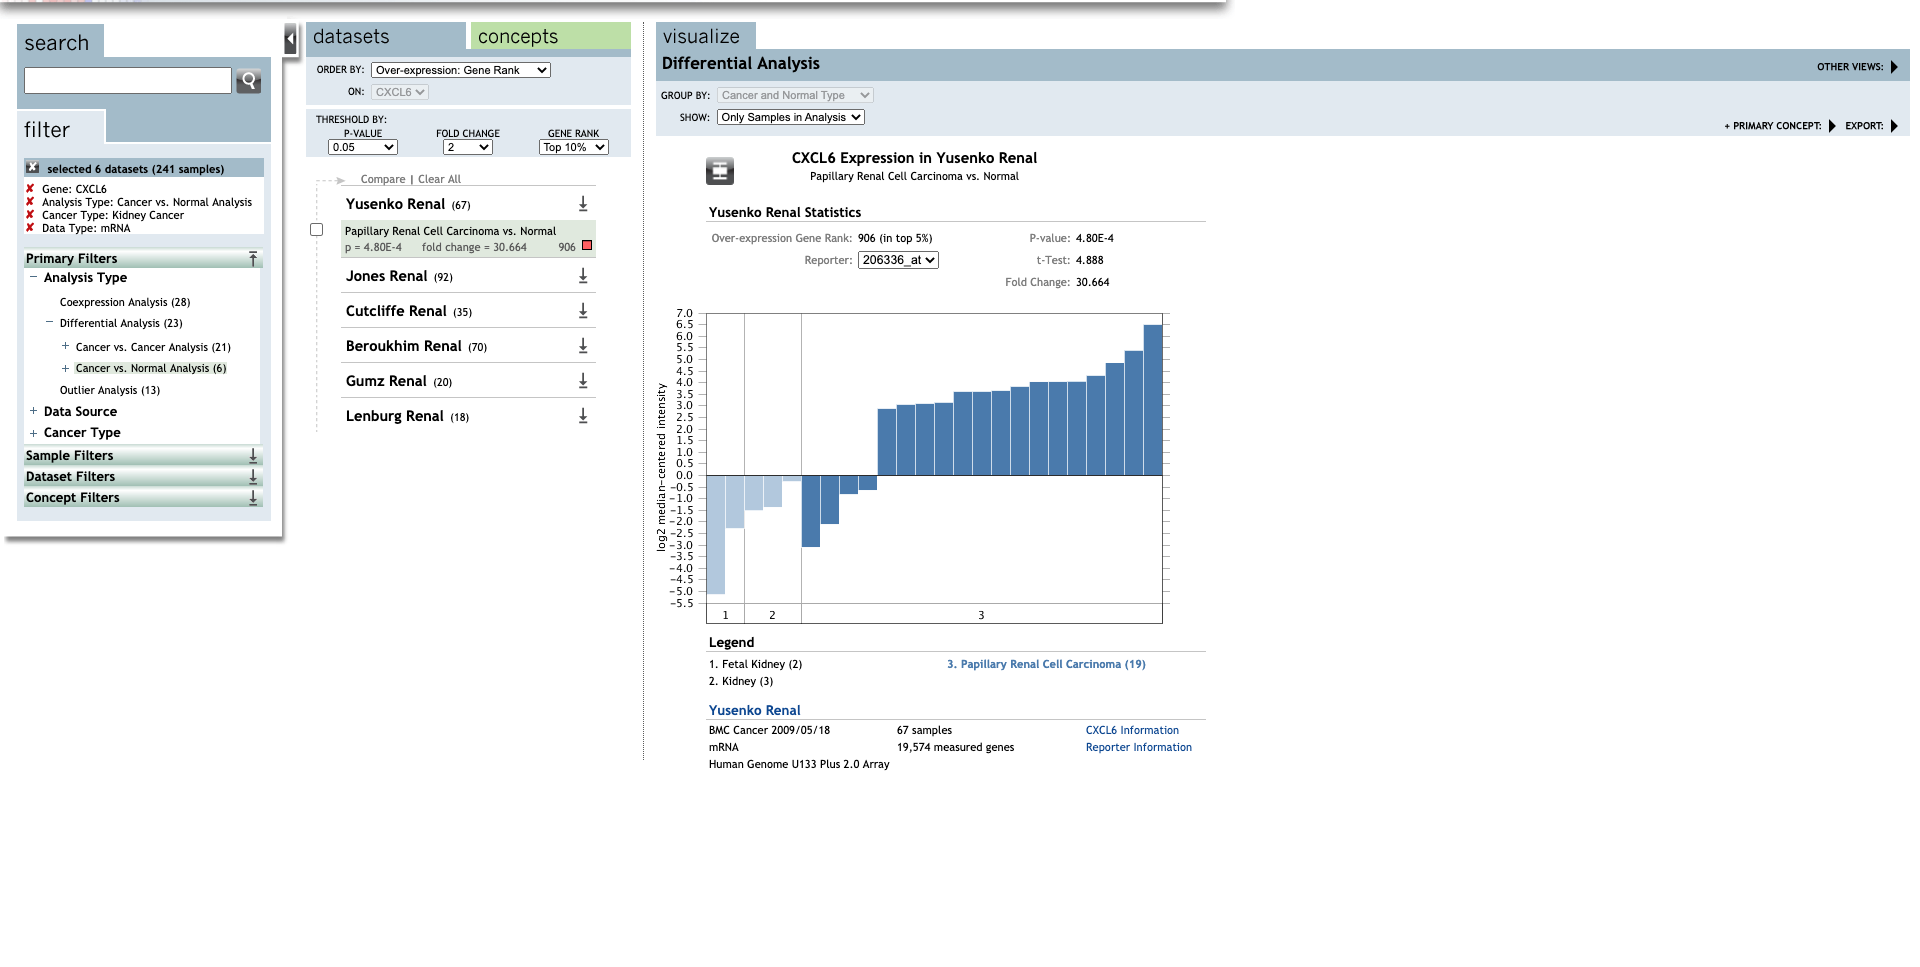
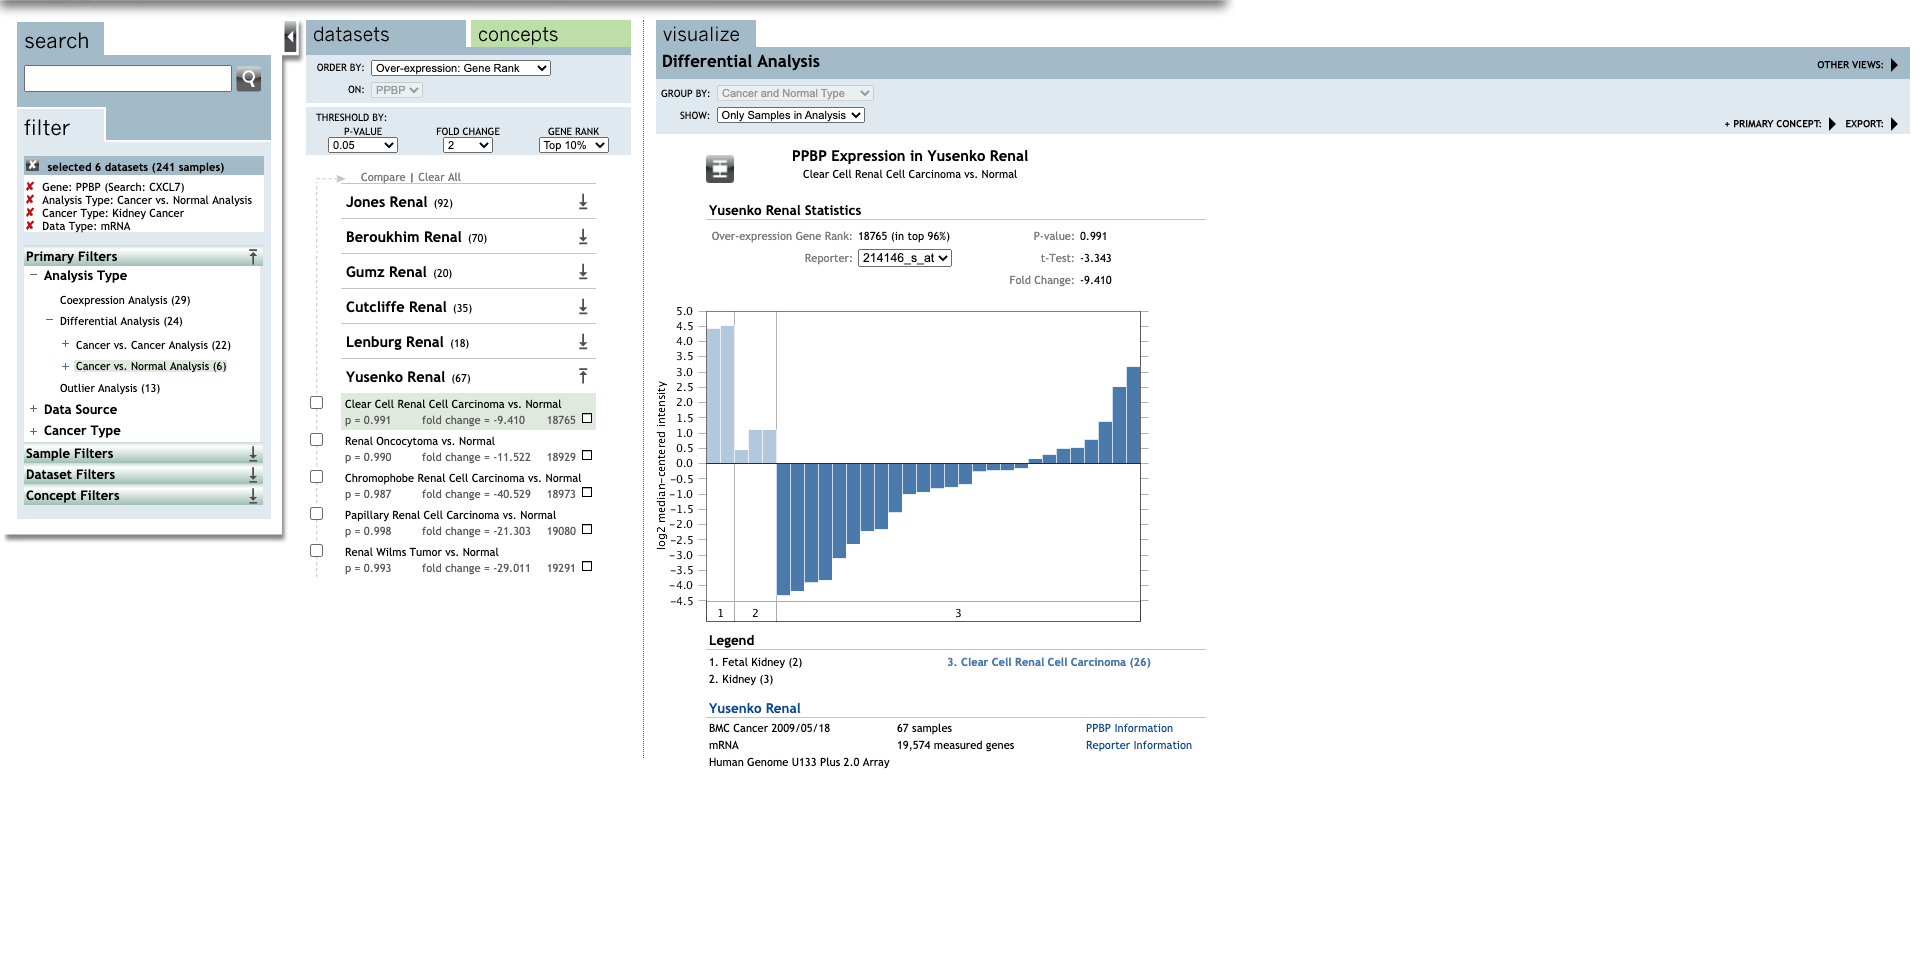
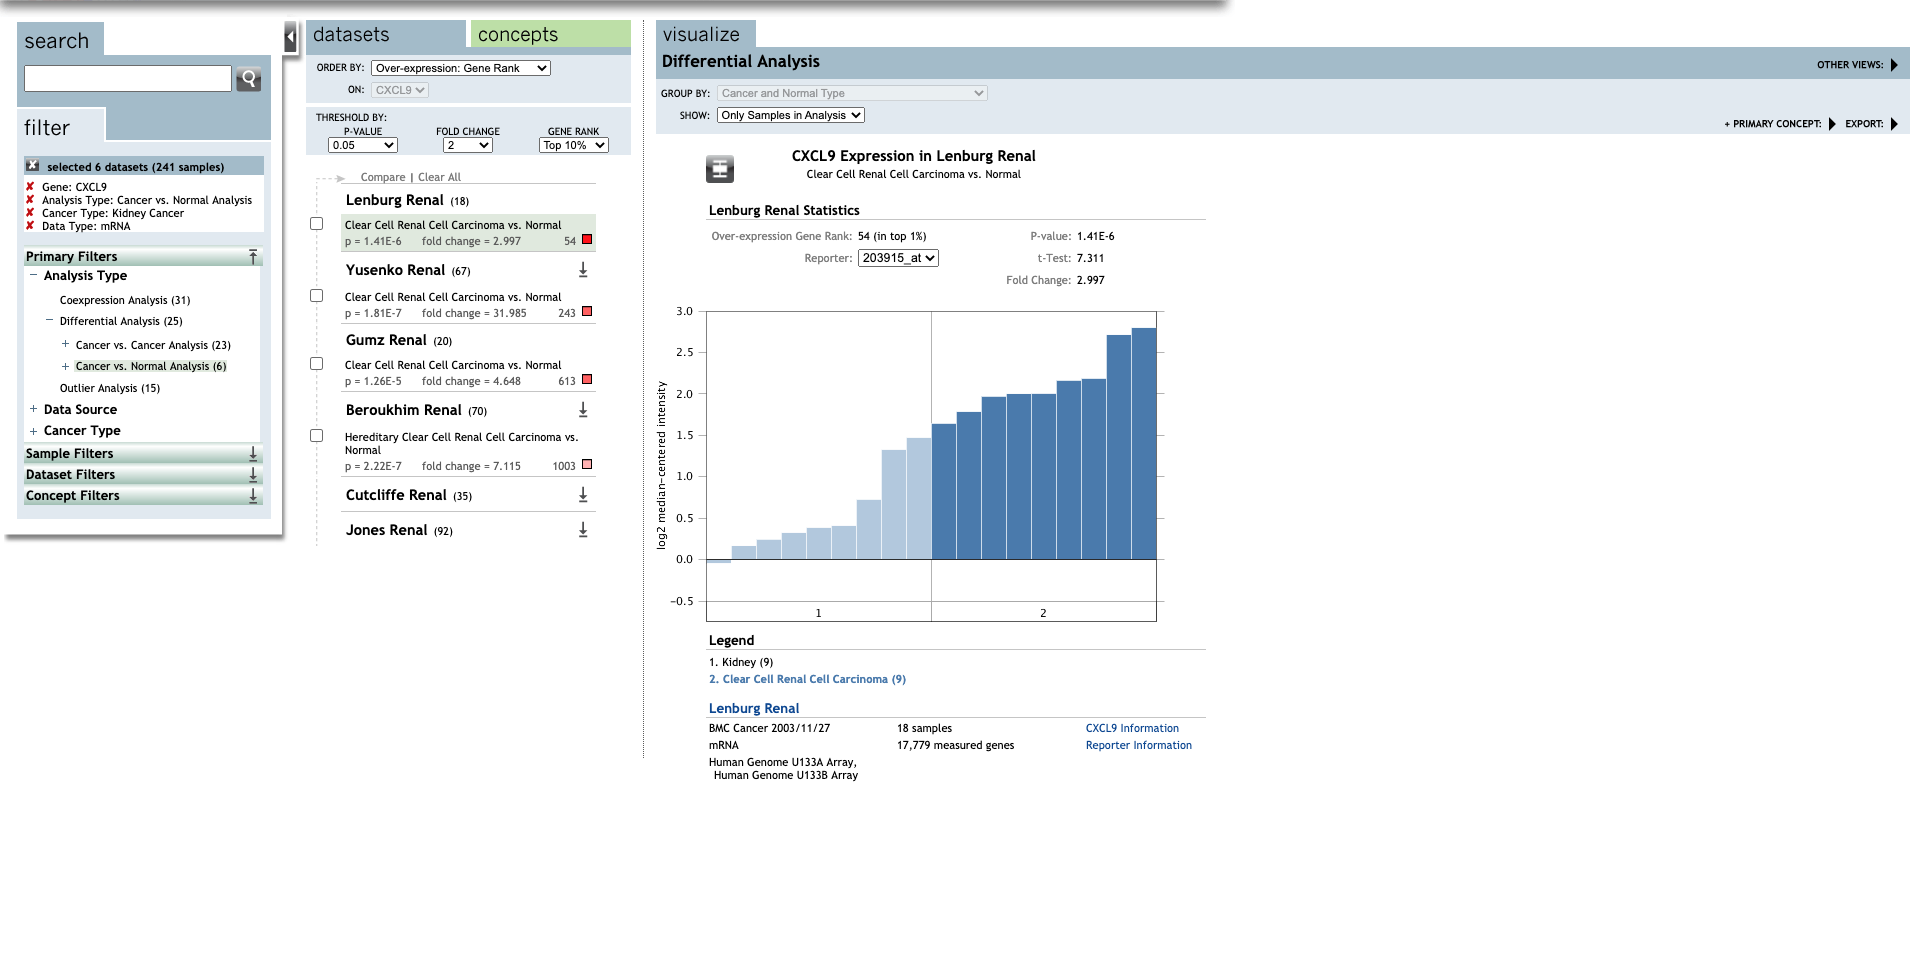
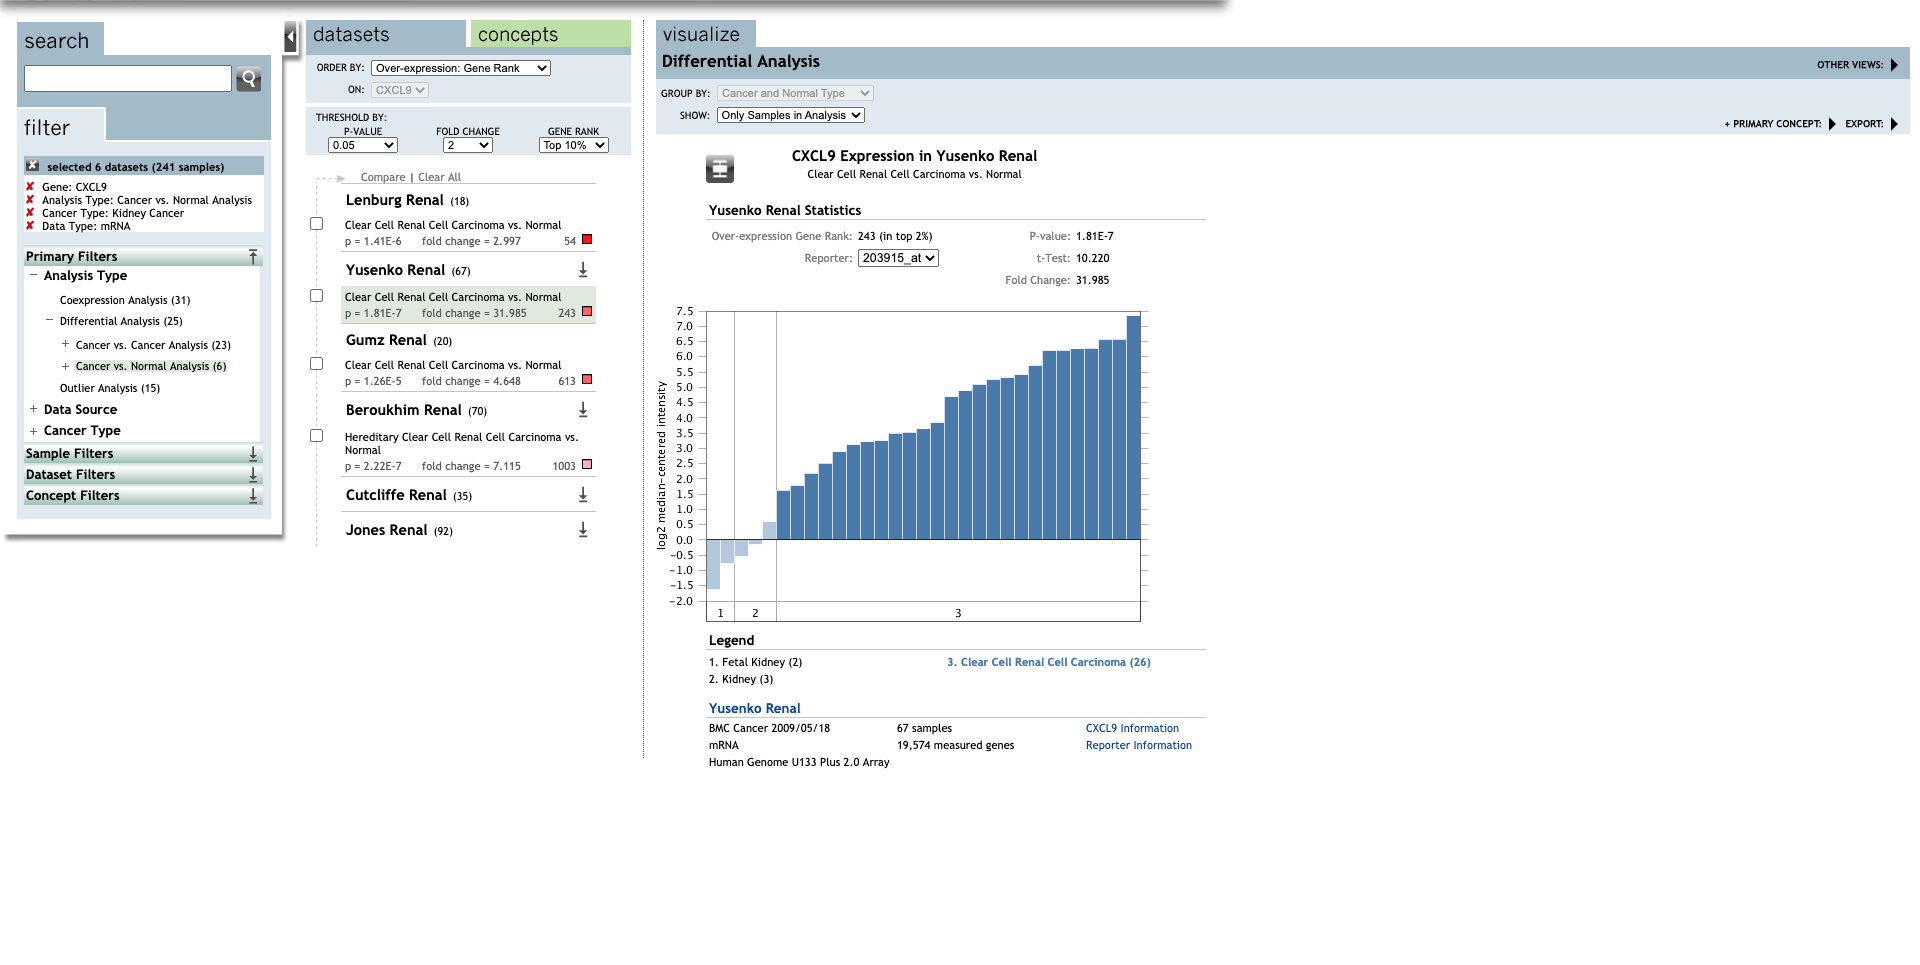
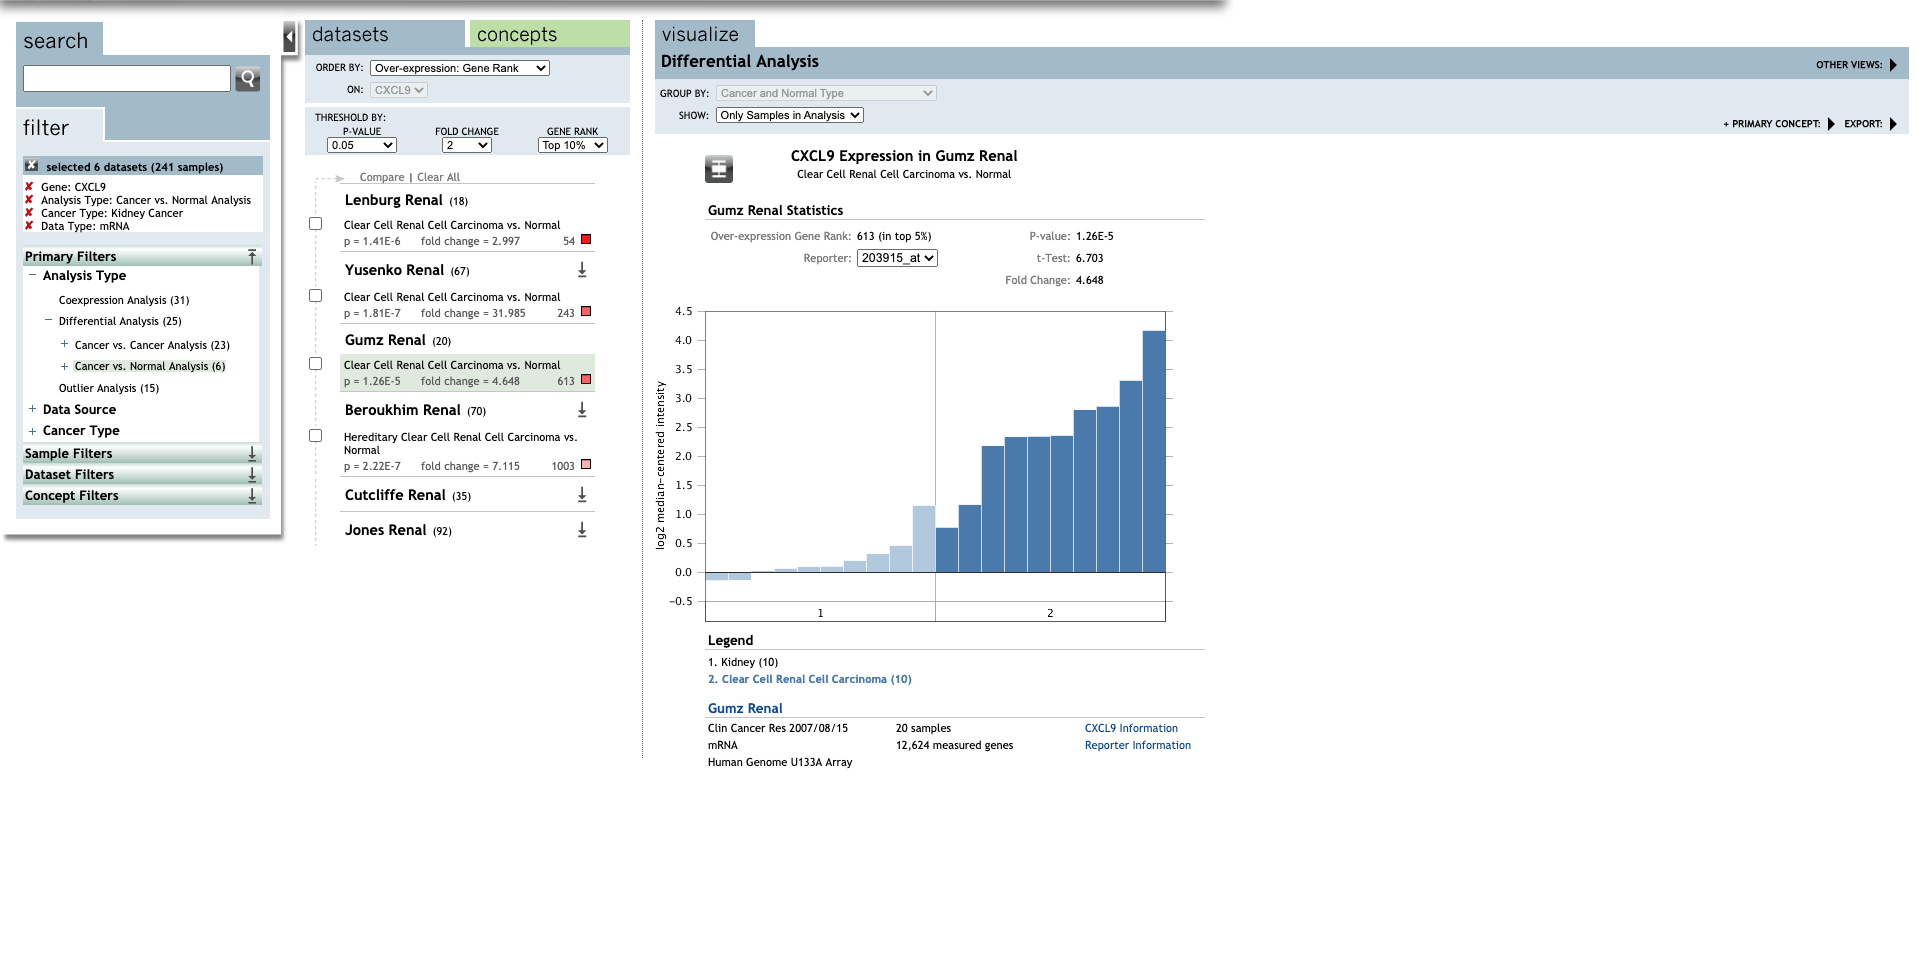
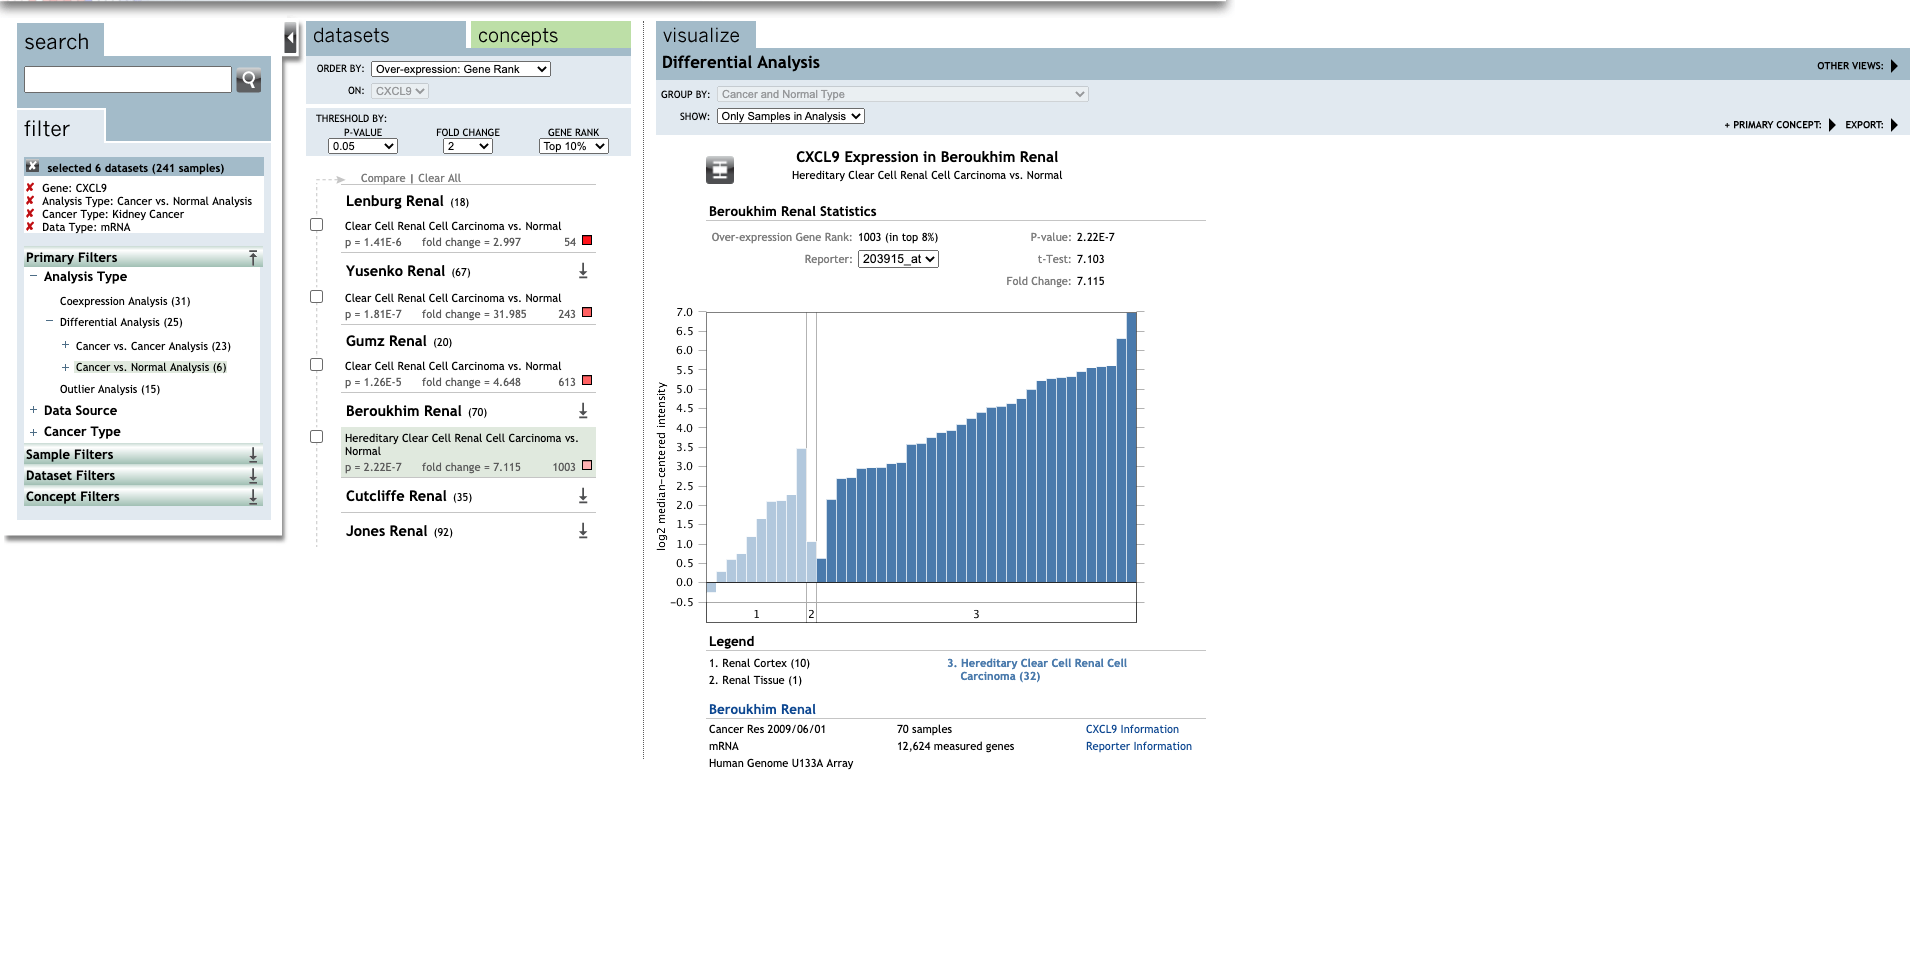
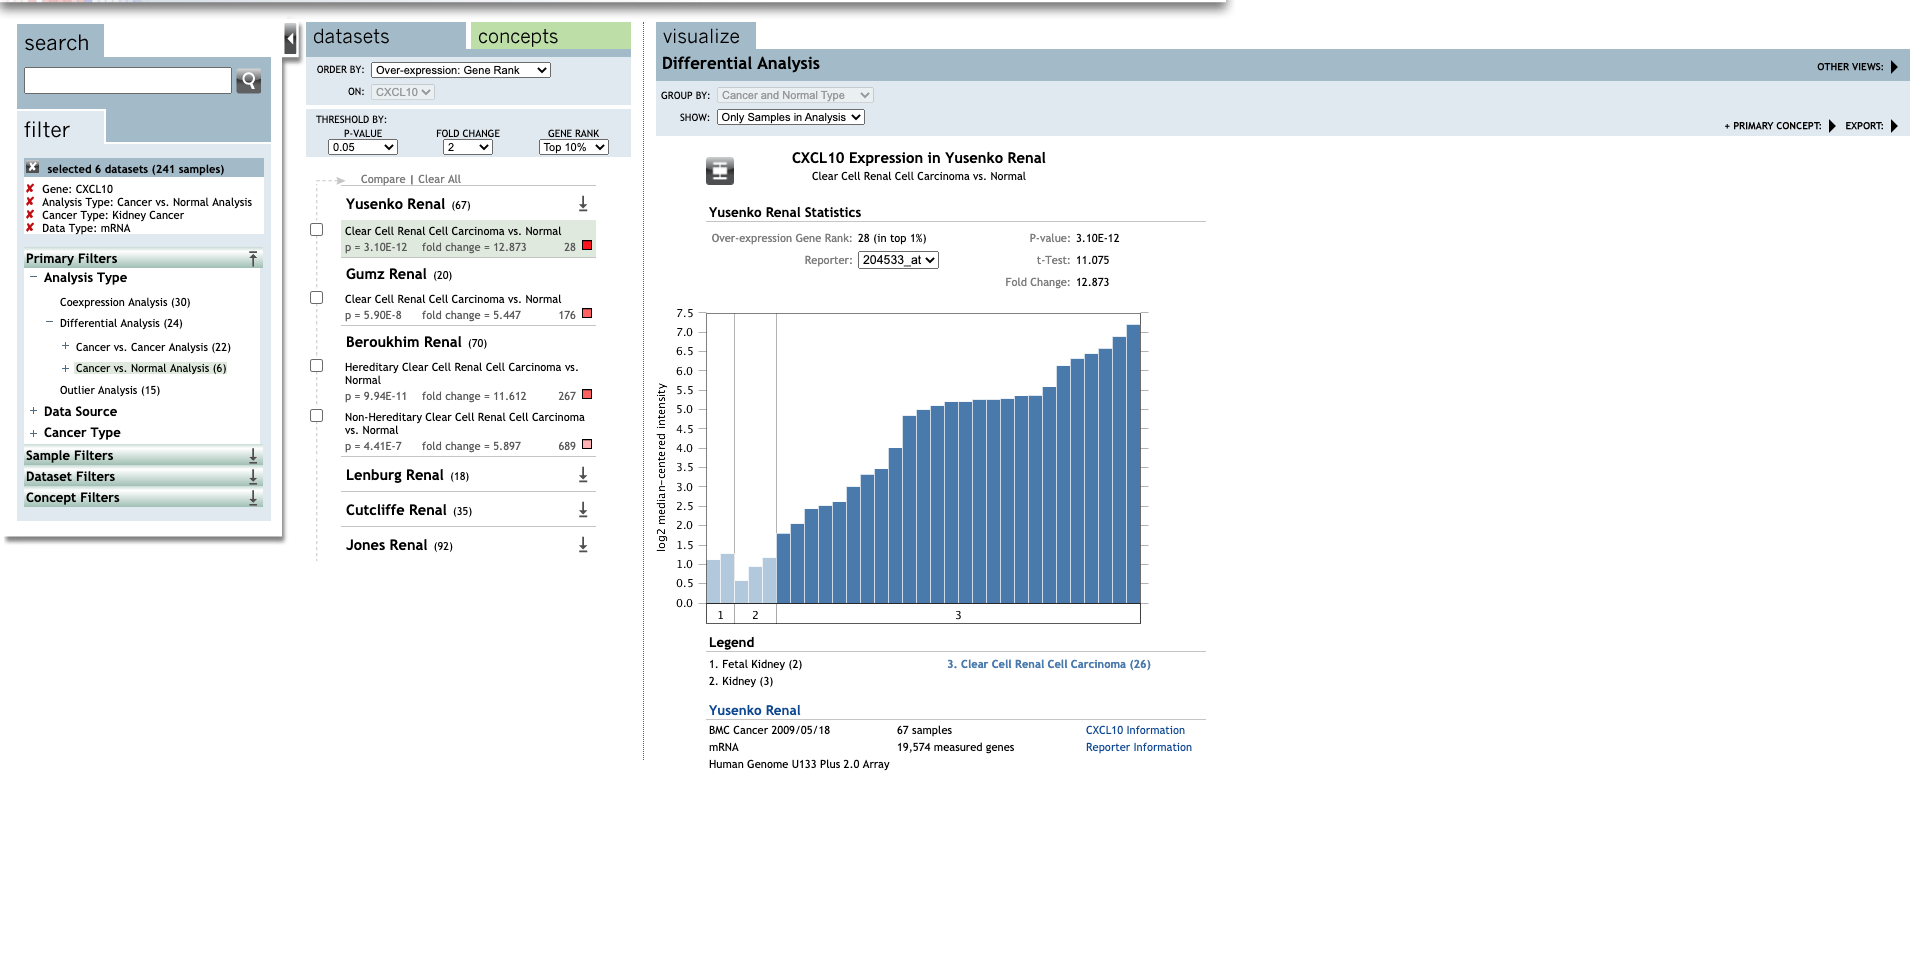
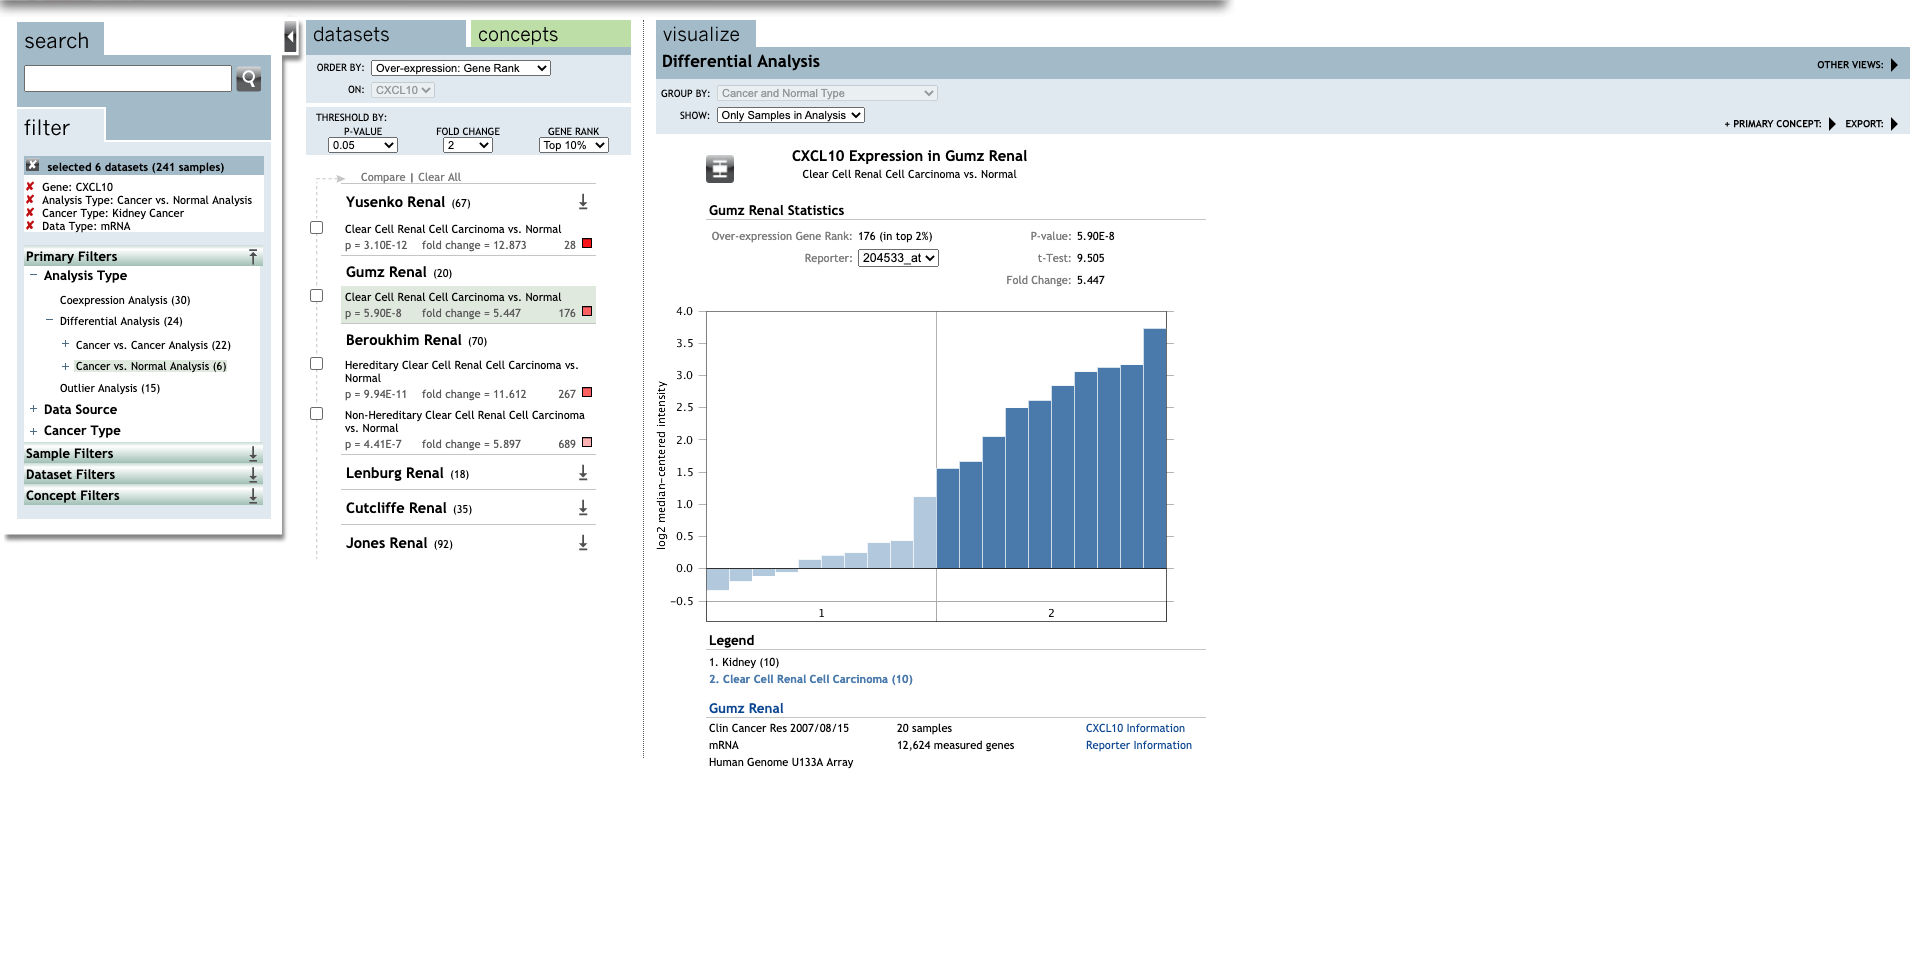
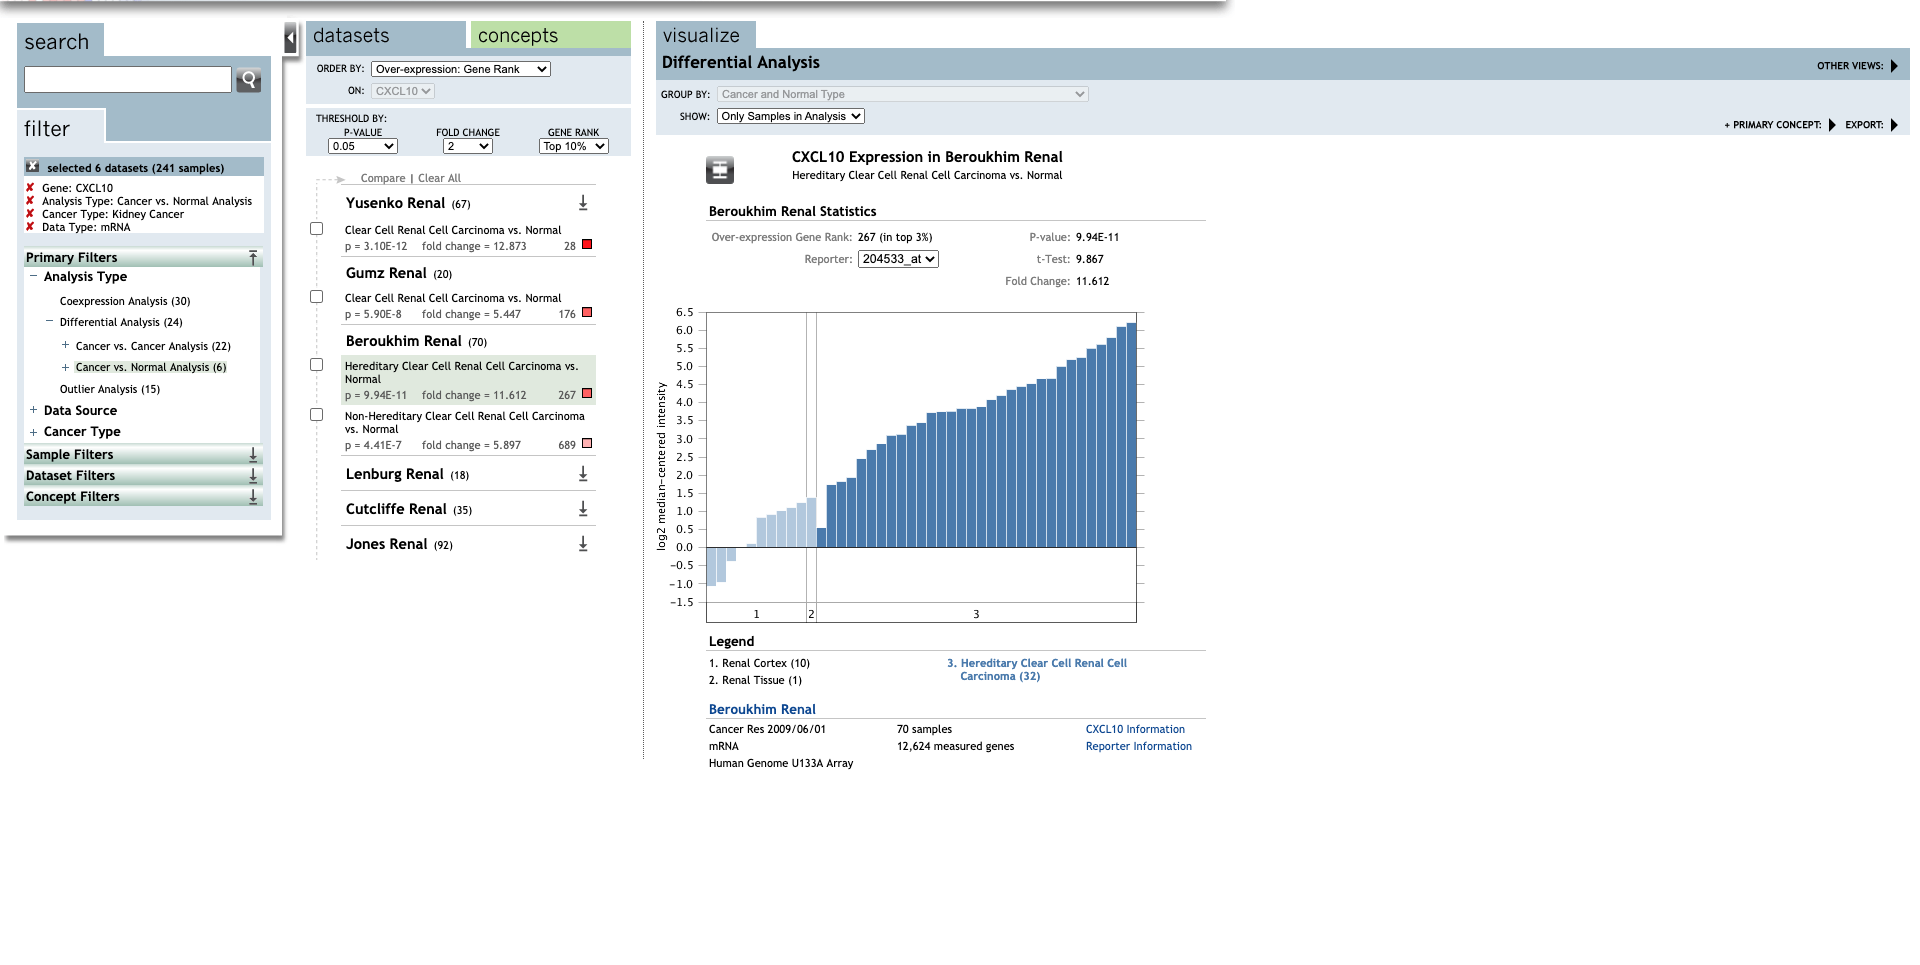
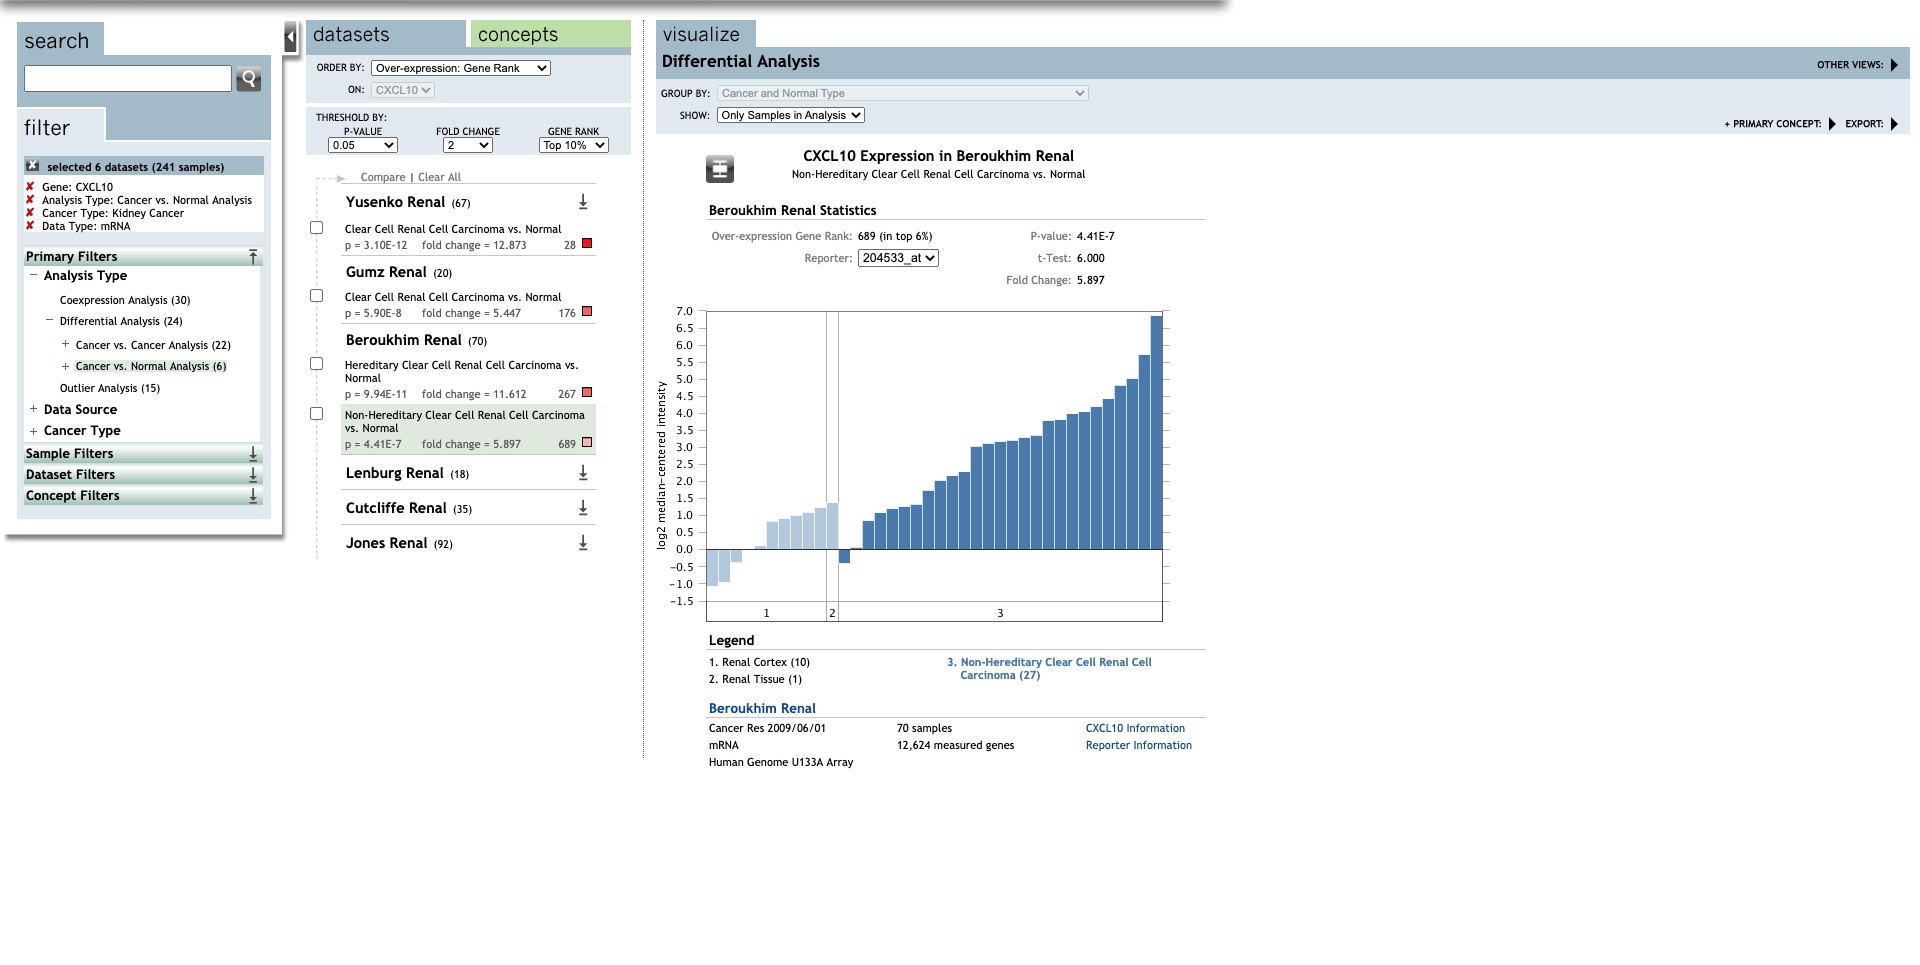
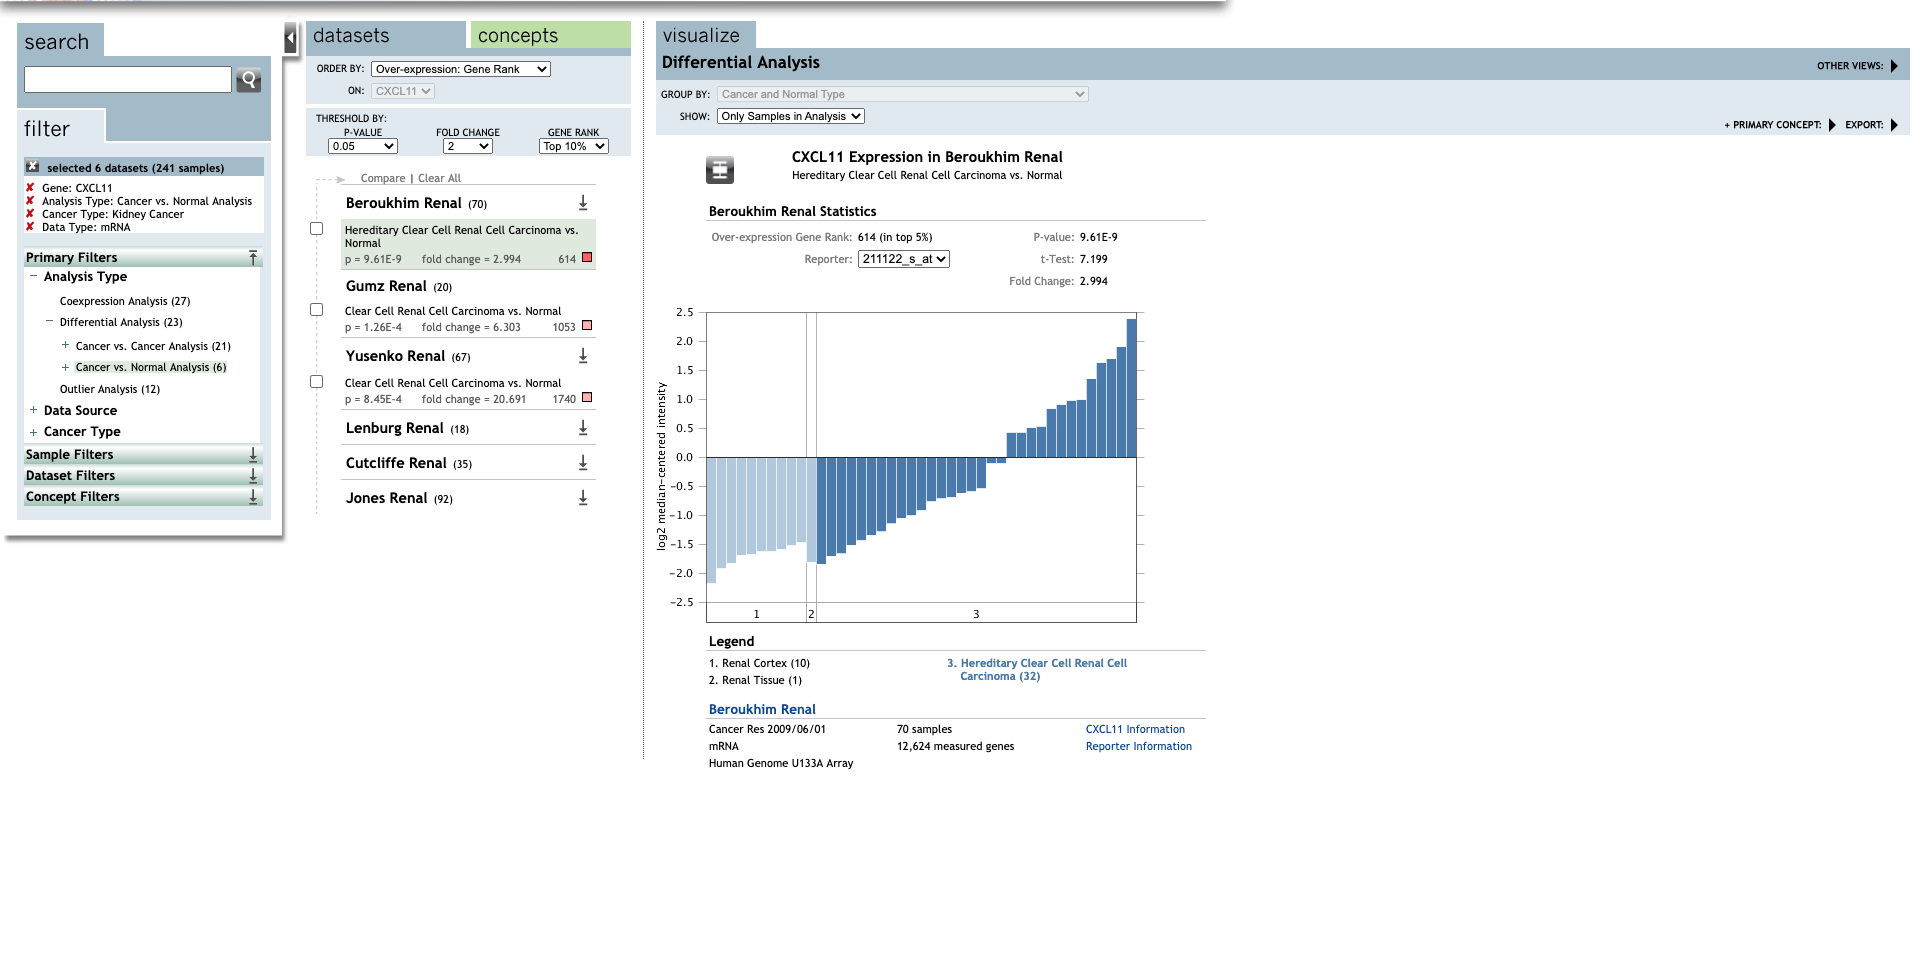
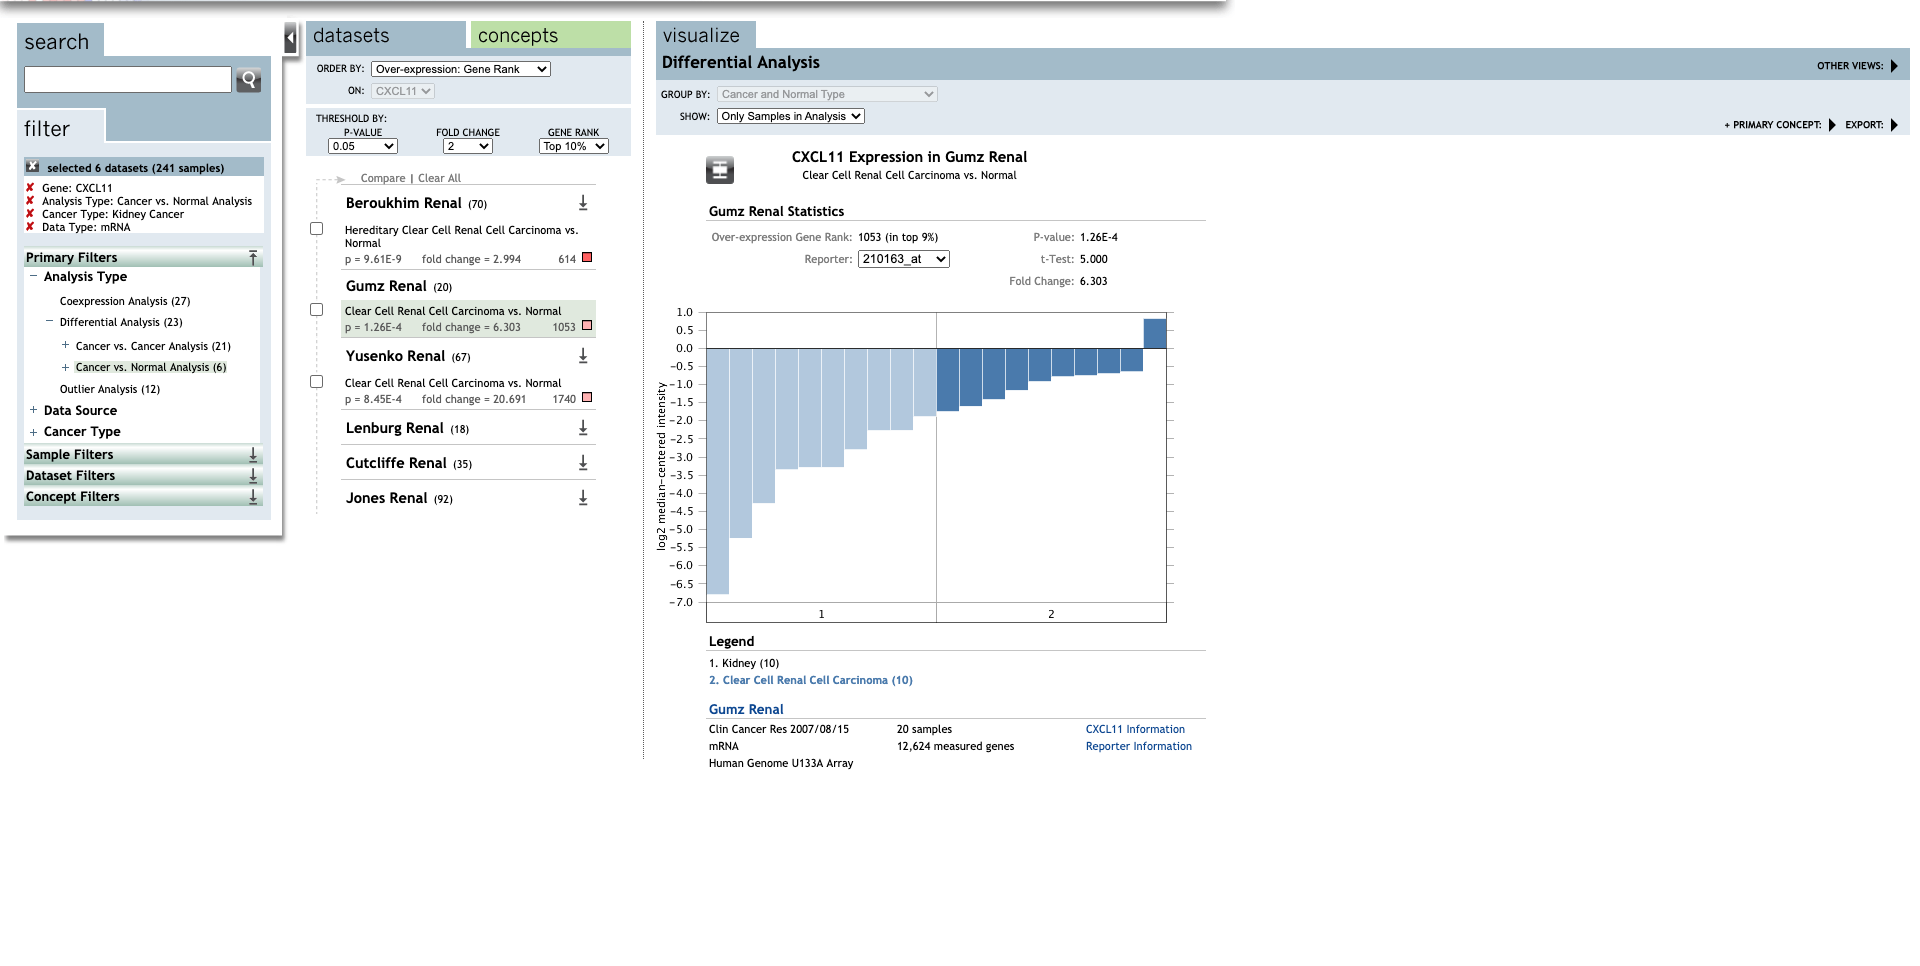
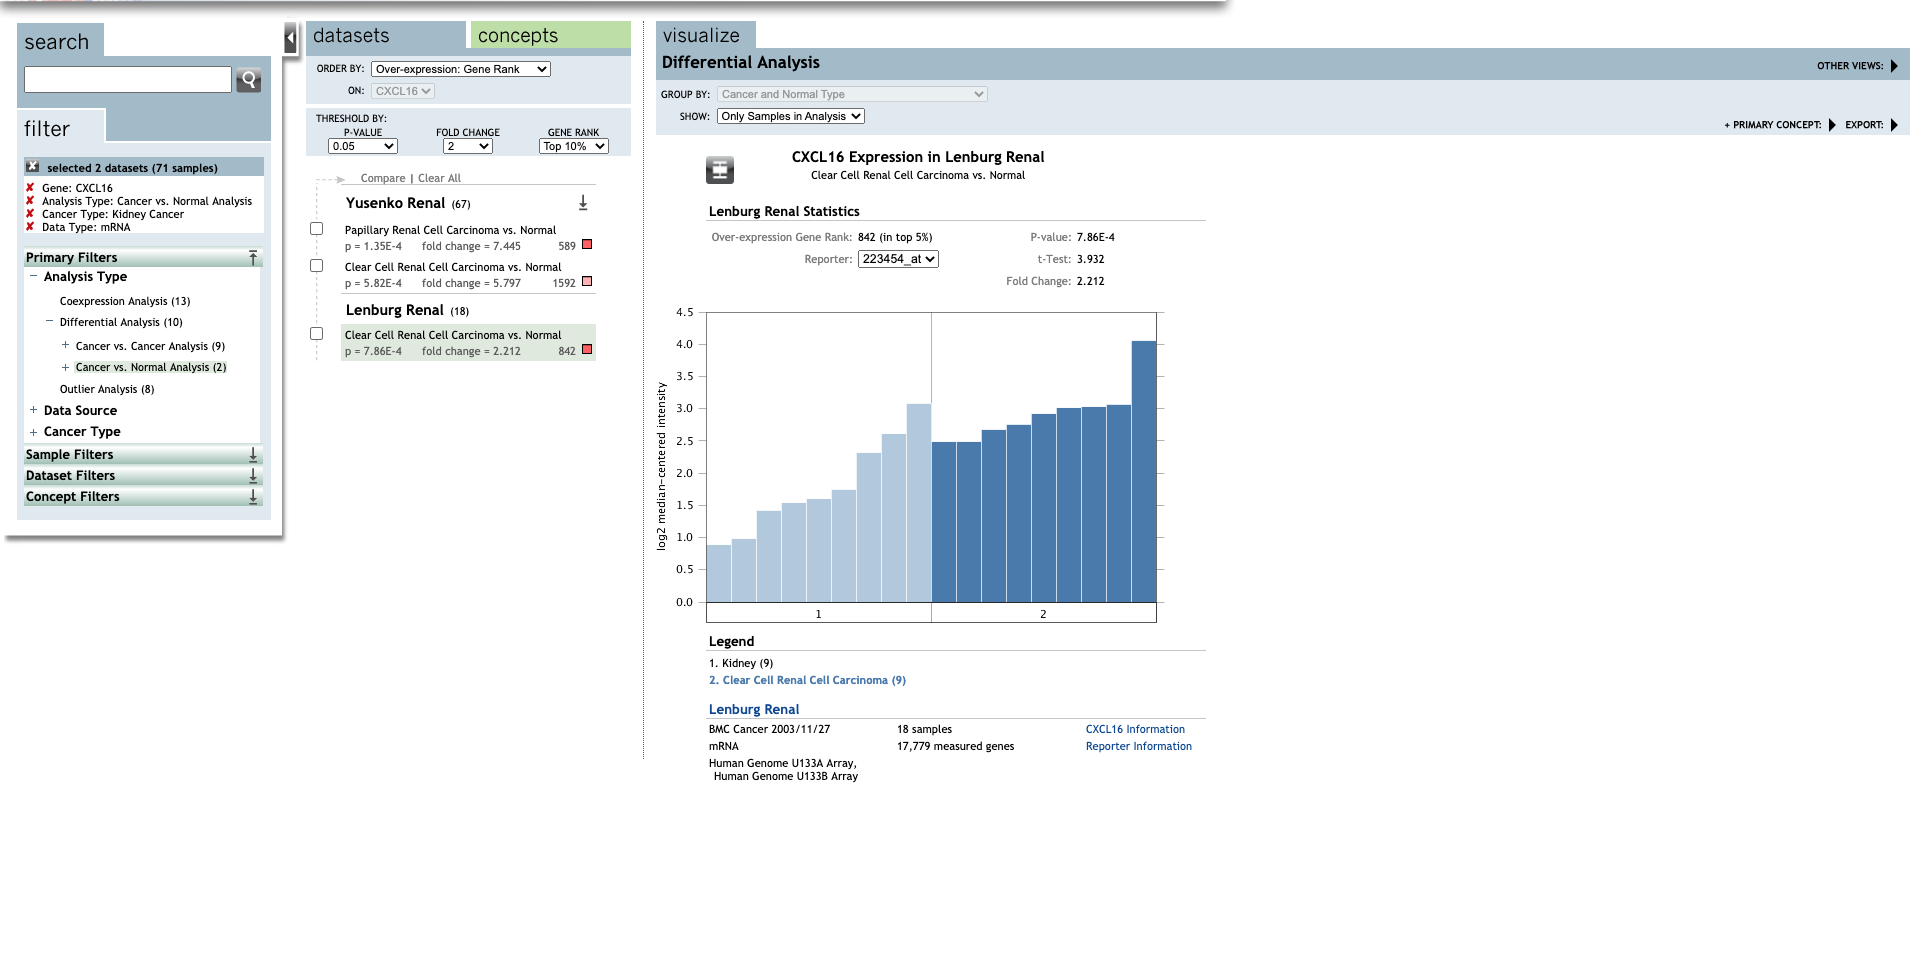
Table 1. The mRNA levels of CXC chemokines in different types of RCC tissues and normal renal tissues at transcriptome level (ONCOMINE)
-
Methods: ONCOMINE.
-
Set up the parameters for CXCL3 gene.
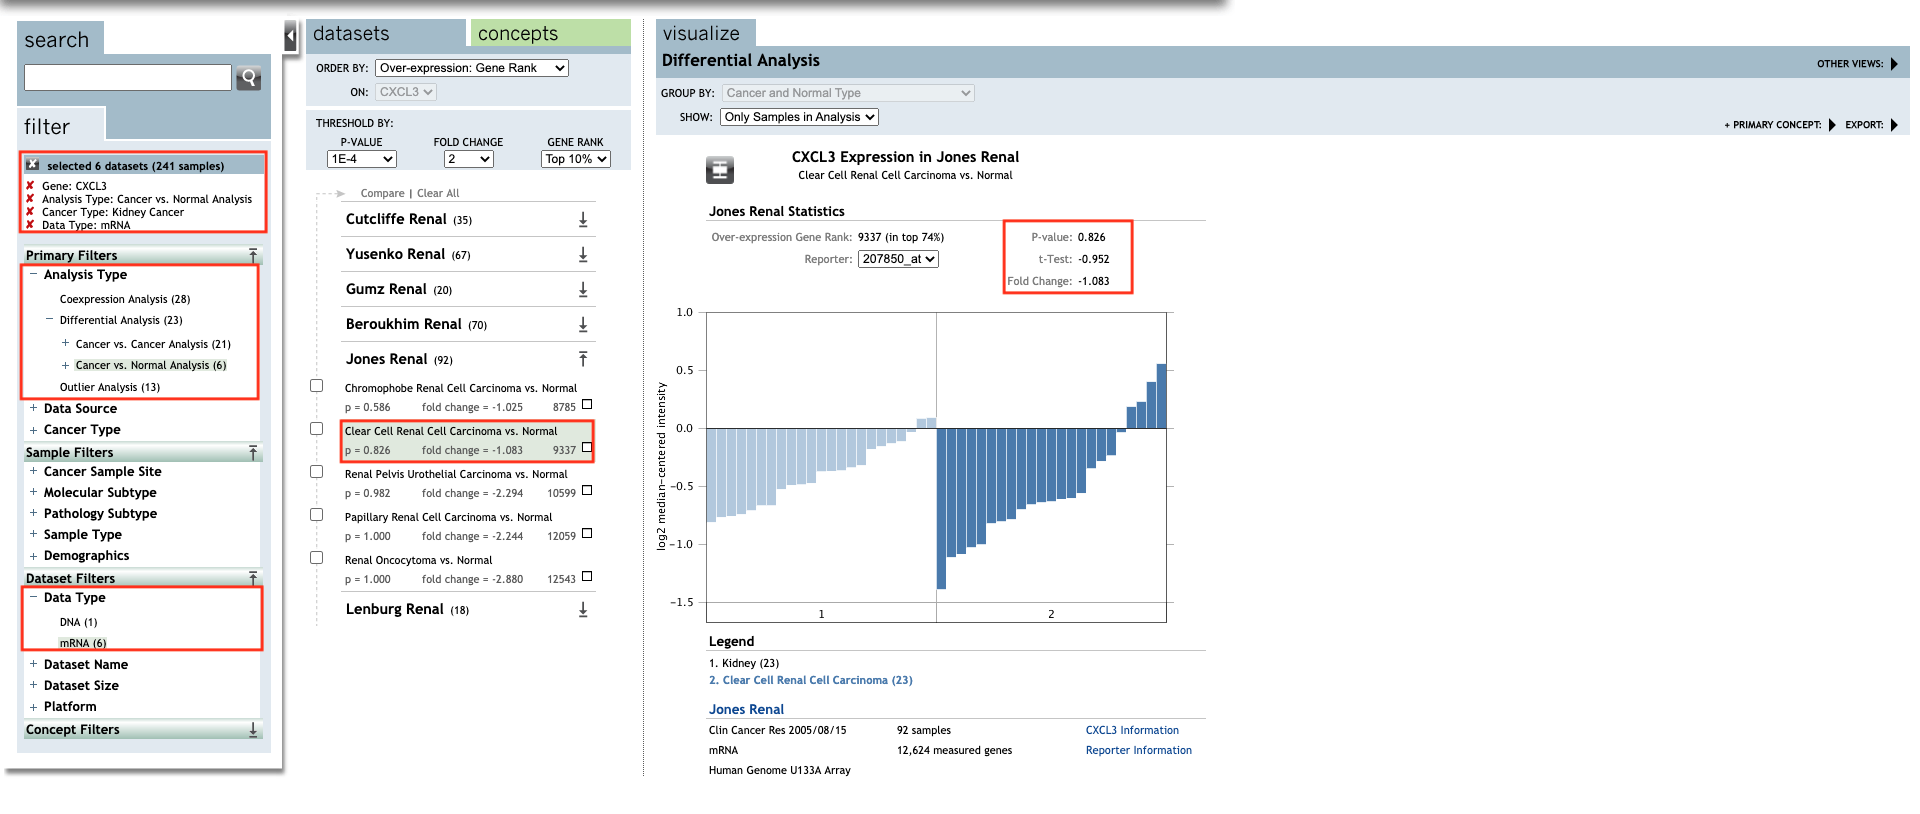
-
Continue, set up the parameters for all CXC chemokines.
| TLR | Type | Fold change | P-value | t-test | References |
|---|---|---|---|---|---|
| CXCL3 | Papillary Renal Cell Carcinoma |
−2.244 | 1.000 |
-8.293 |
(26) |
| CXCL6 | Clear Cell Renal Cell Carcinoma | 30.664 | 4.80E-4 | 4.888 | (27) |
| CXCL7 | Clear Cell Renal Cell Carcinoma | −9.410 | 0.991 |
−3.343 | (27) |
| CXCL9 | Clear Cell Renal Cell Carcinoma | 2.997 | 1.41E-6 | 7.311 | (28) |
| Clear Cell Renal Cell Carcinoma | 31.985 | 1.81E-7 | 10.220 | (27) | |
| Clear Cell Renal Cell Carcinoma | 4.648 | 1.26E-5 | 6.703 | (30) | |
| Clear Cell Renal Cell Carcinoma | 7.115 | 2.22E-7 | 7.103 |
(29) | |
| CXCL10 | Clear Cell Renal Cell Carcinoma | 12.873 | 3.10E-12 | 11.075 | (27) |
| Clear Cell Renal Cell Carcinoma | 5.447 | 5.90E-8 | 9.505 | (30) | |
| Hereditary Clear Cell Renal Cell Carcinoma | 11.612 | 9.94E-11 | 9.867 | (29) | |
| Non-Hereditary Clear Cell Renal Cell Carcinoma | 5.897 | 4.41E-7 | 6.000 | (29) | |
| CXCL11 | Hereditary Clear Cell Renal Cell Carcinoma | 2.994 | 9.61E-9 | 7.199 | (29) |
| Clear Cell Renal Cell Carcinoma | 6.303 | 1.26E-4 | 5.000 | (30) | |
| Clear Cell Renal Cell Carcinoma | 20.691 | 8.45E-4 | 5.712 | (27) | |
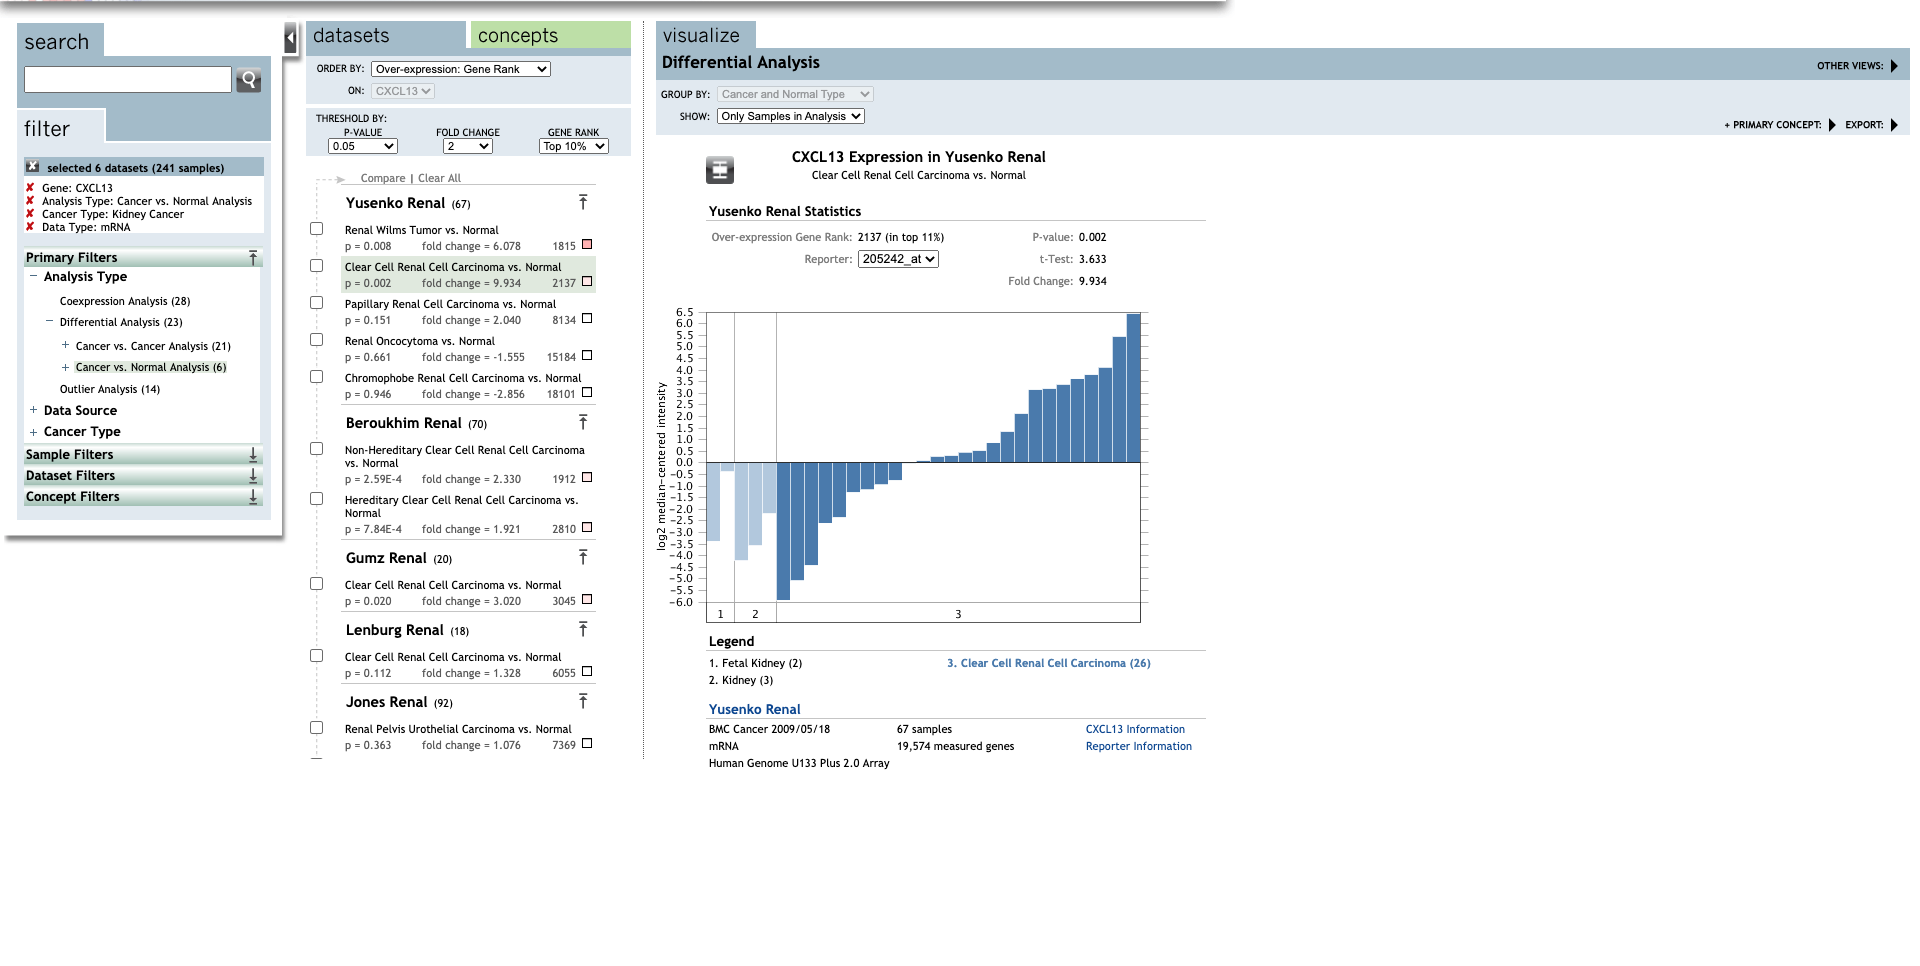
| CXCL13 | Clear Cell Renal Cell Carcinoma | 9.934 |
0.002 |
3.633 |
(27) |
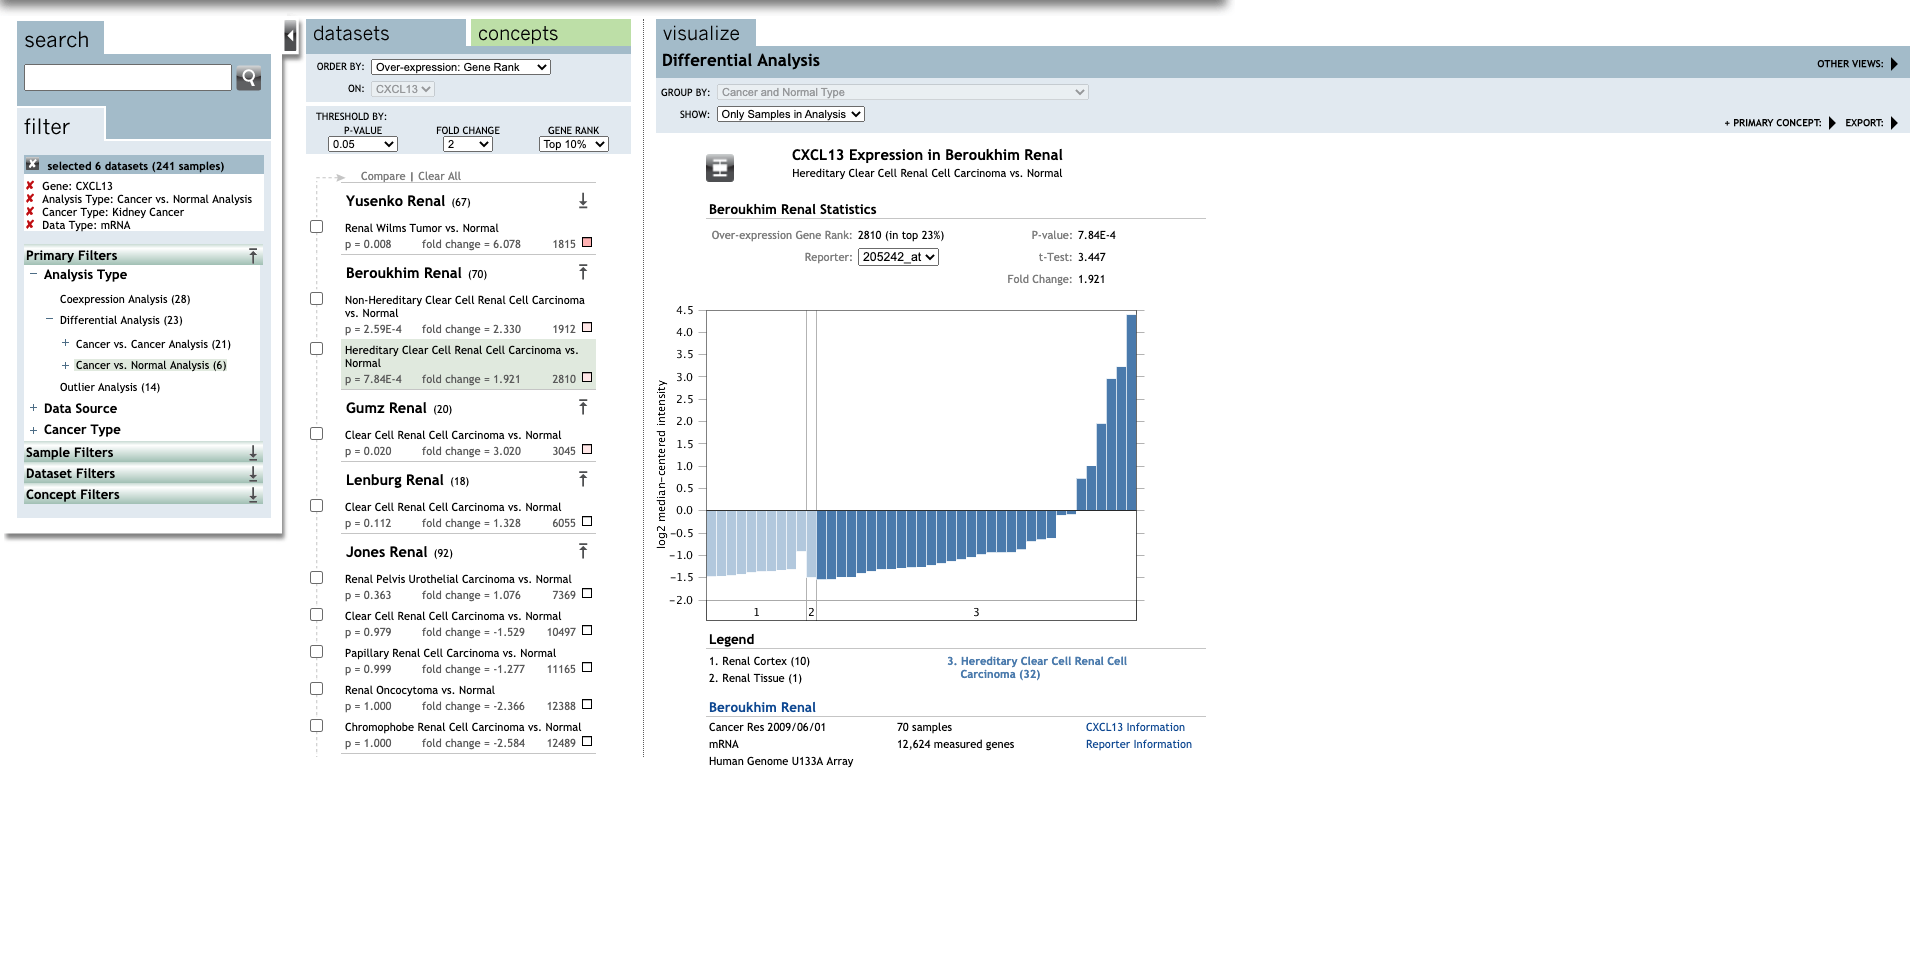
| Hereditary Clear Cell Renal Cell Carcinoma | 1.921 |
7.84E-4 |
3.447 |
(29) | |
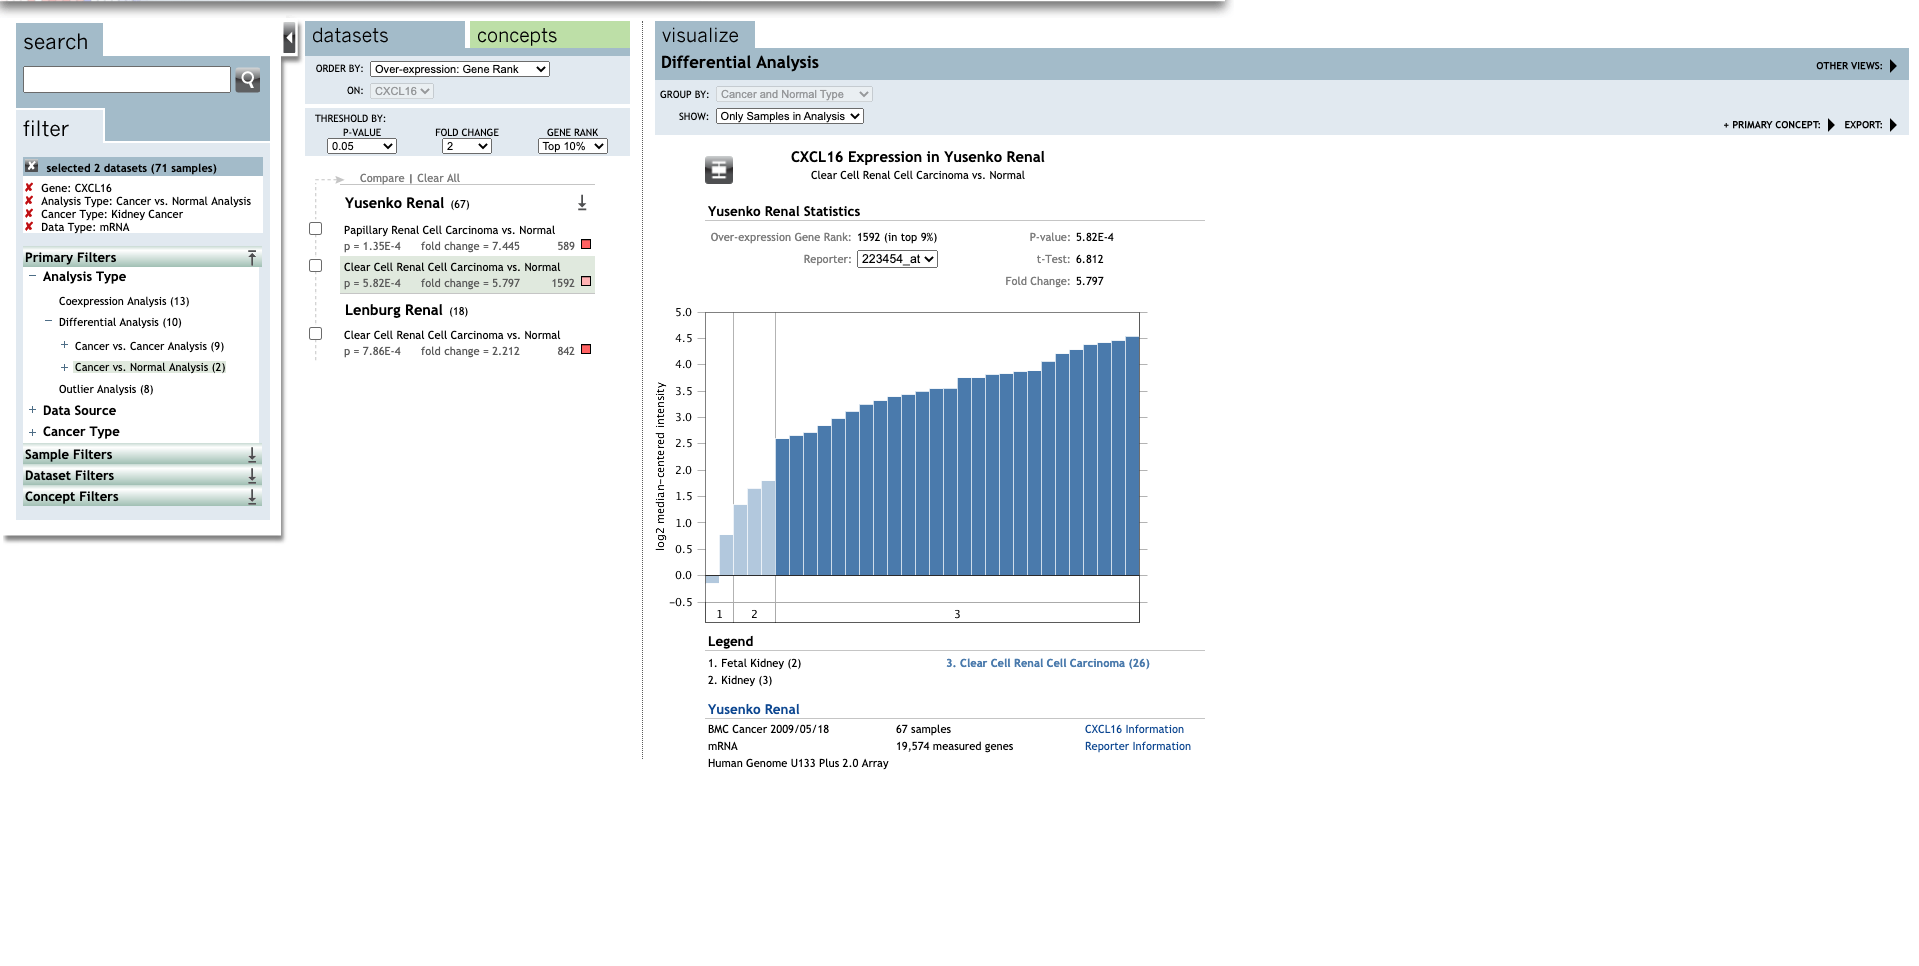
| CXCL16 | Clear Cell Renal Cell Carcinoma | 5.797 | 5.82E-4 | 6.812 | (27) |
| Clear Cell Renal Cell Carcinoma | 2.212 | 7.86E-4 | 3.932 | (28) |
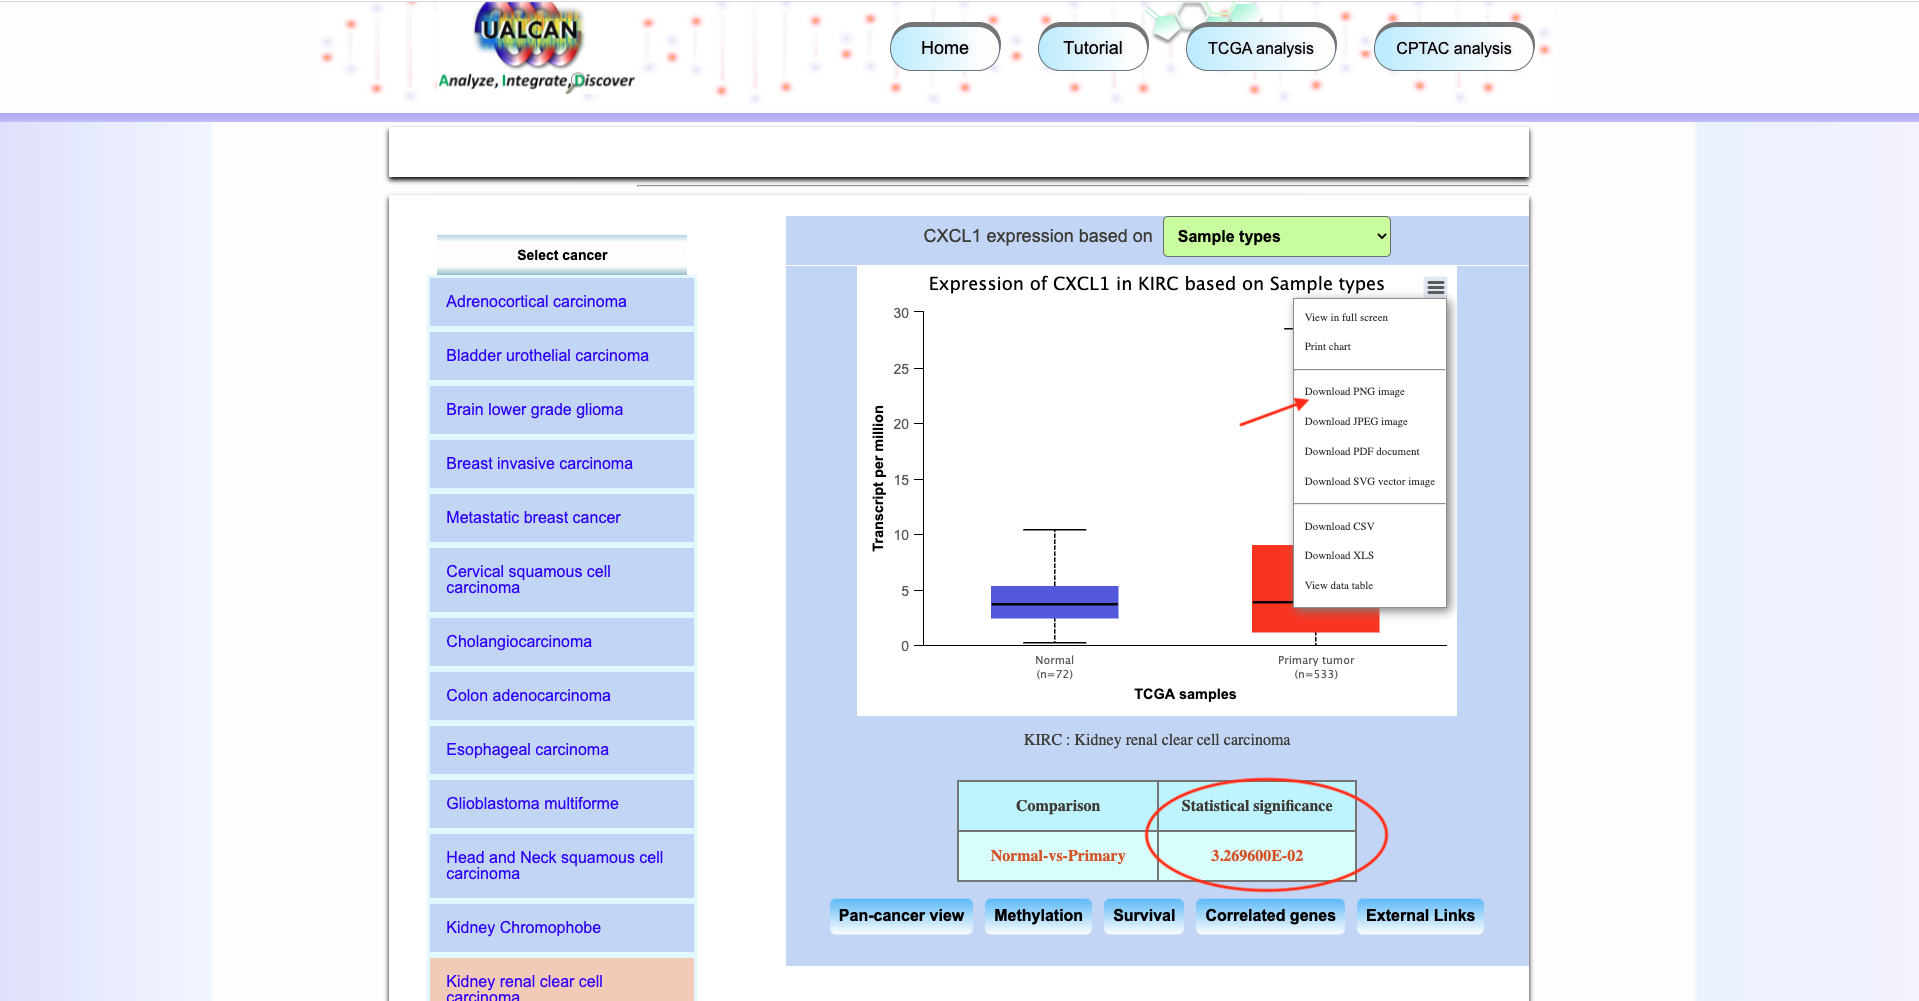
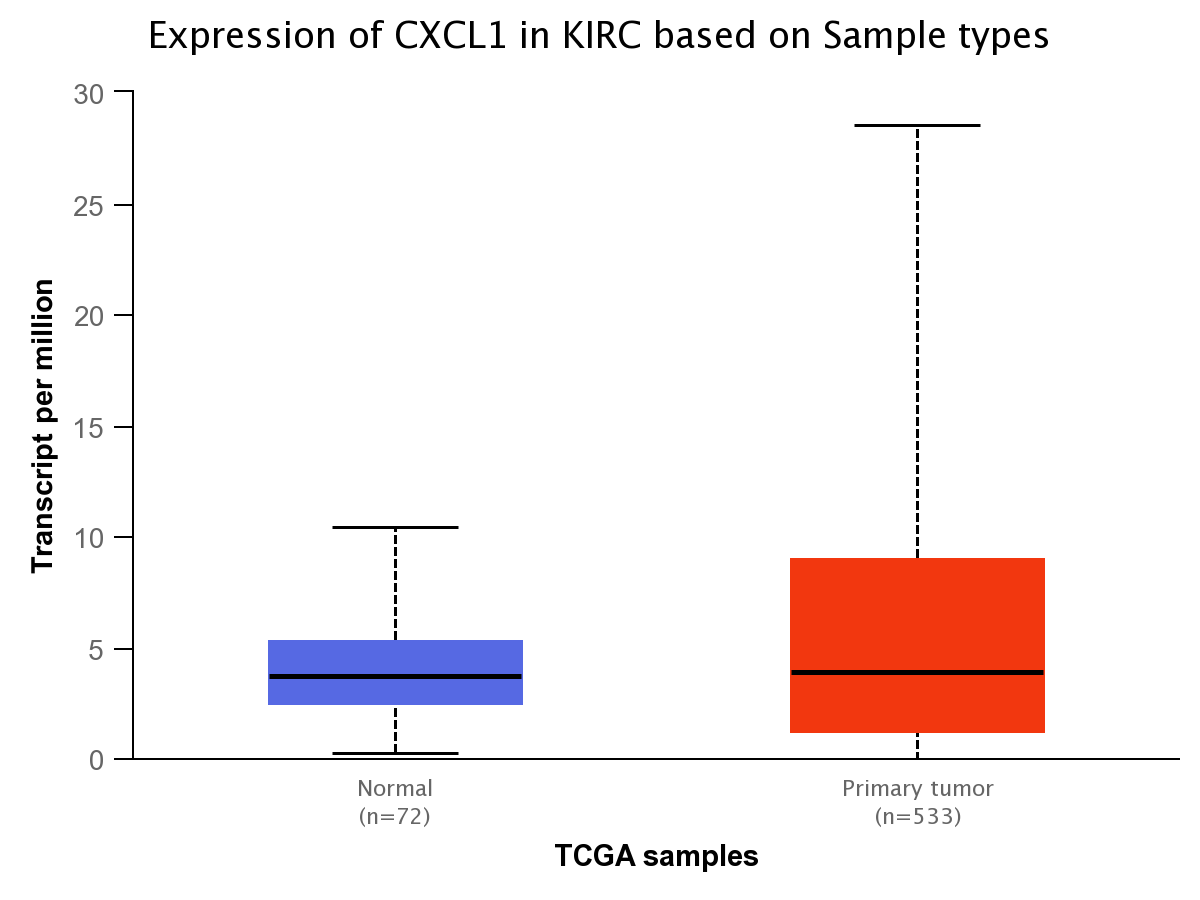
Figure 2. The transcription of CXC chemokines in RCC (UALCAN)
-
Methods: UALCAN.
-
Open UALCAN database
-
Click on the button
TCGA analysisand explore the result for CXCL1 gene.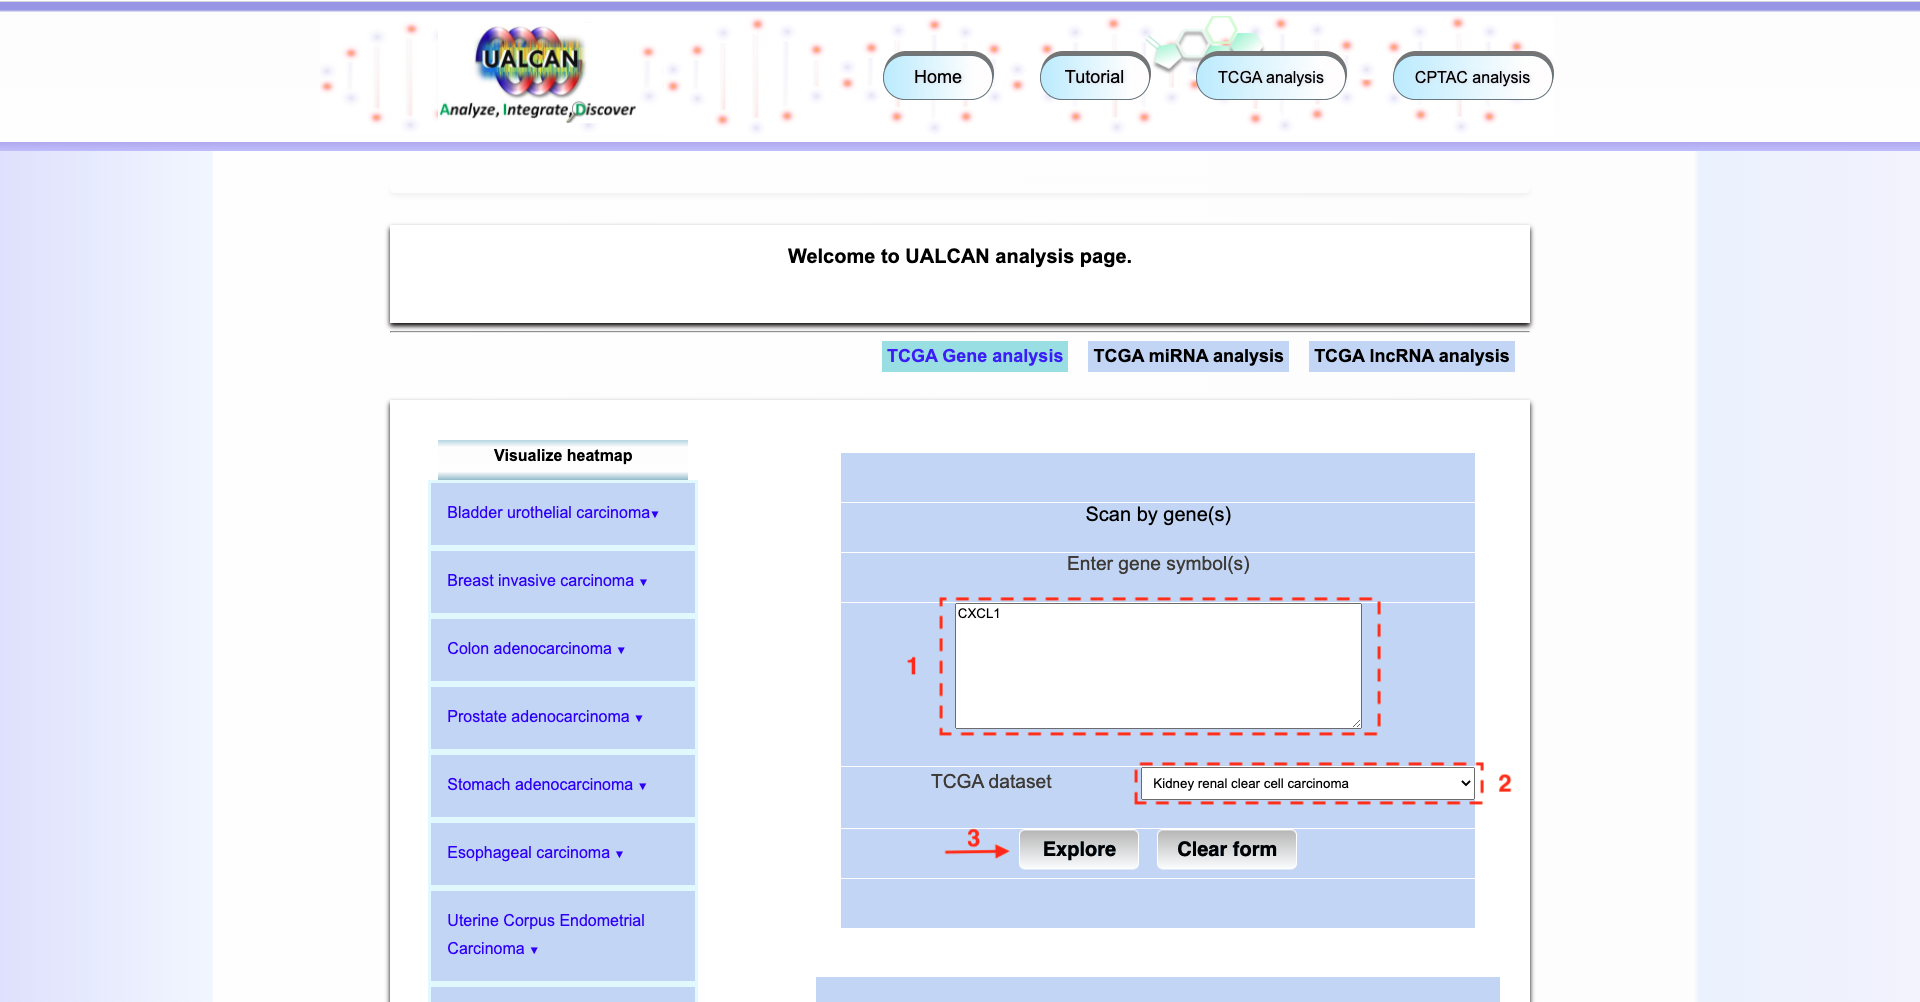
-
Click on the button
Expressionand generate the expression result of CXCL1 gene.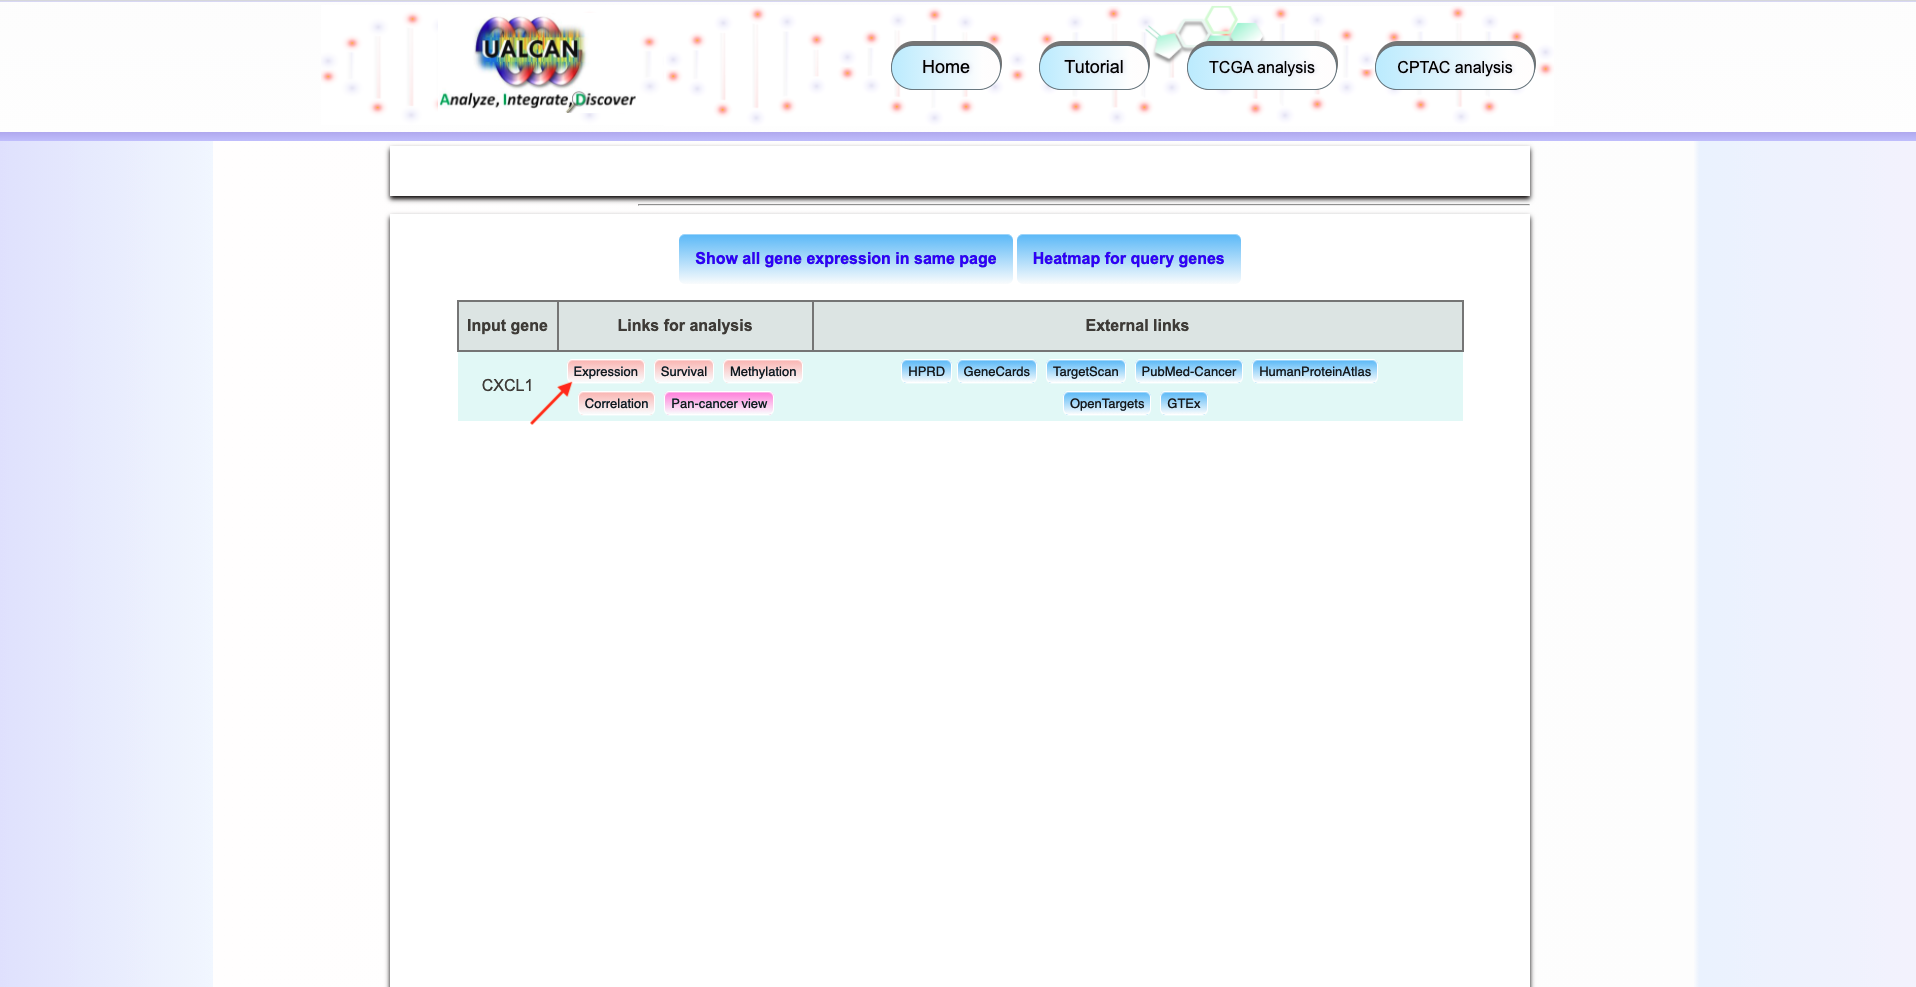
-
Merge all CXC chemokines together with Google Slides
- The transcriptional levels of CXCL12(G) were significantly reduced.
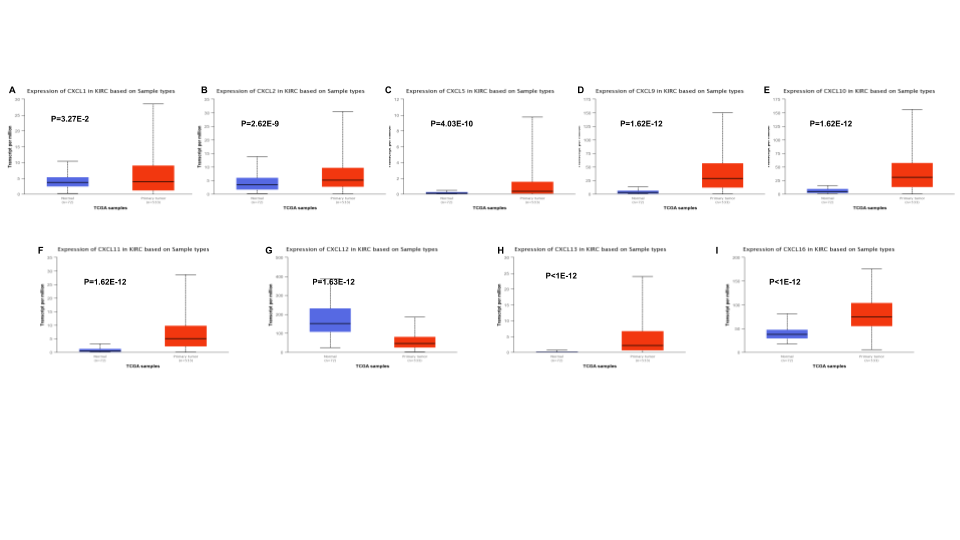
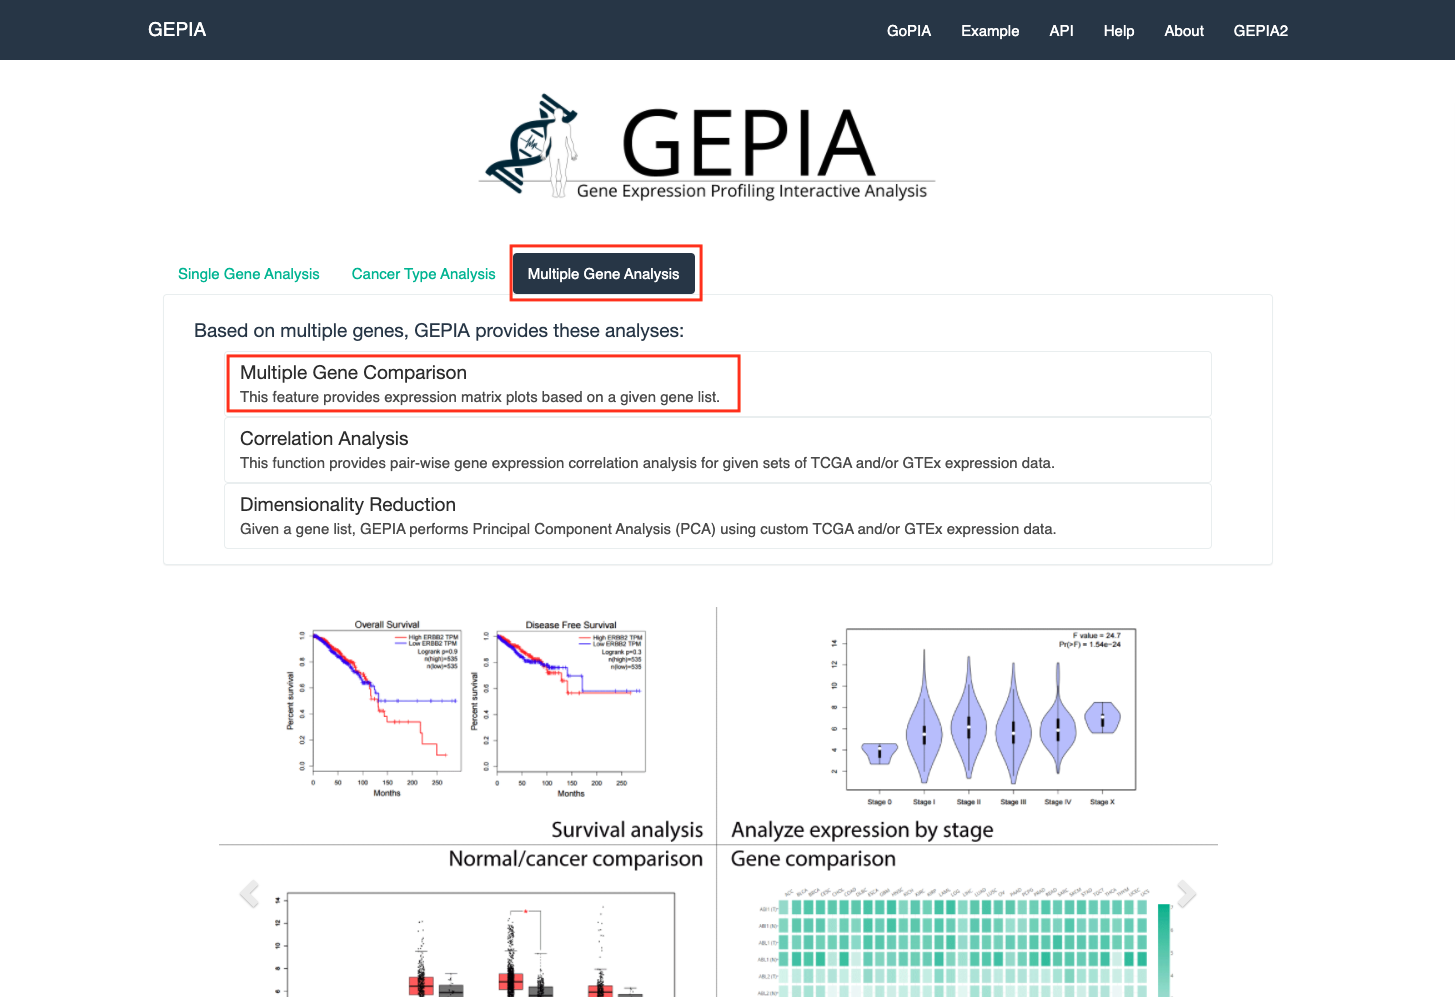
Figure 3. The relative level of CXC chemokines in RCC
-
Open GEPIA
-
Click on the button
Multiple Gene AnalysisandMultiple Gene Comparison -
Set up the parameters and click the button
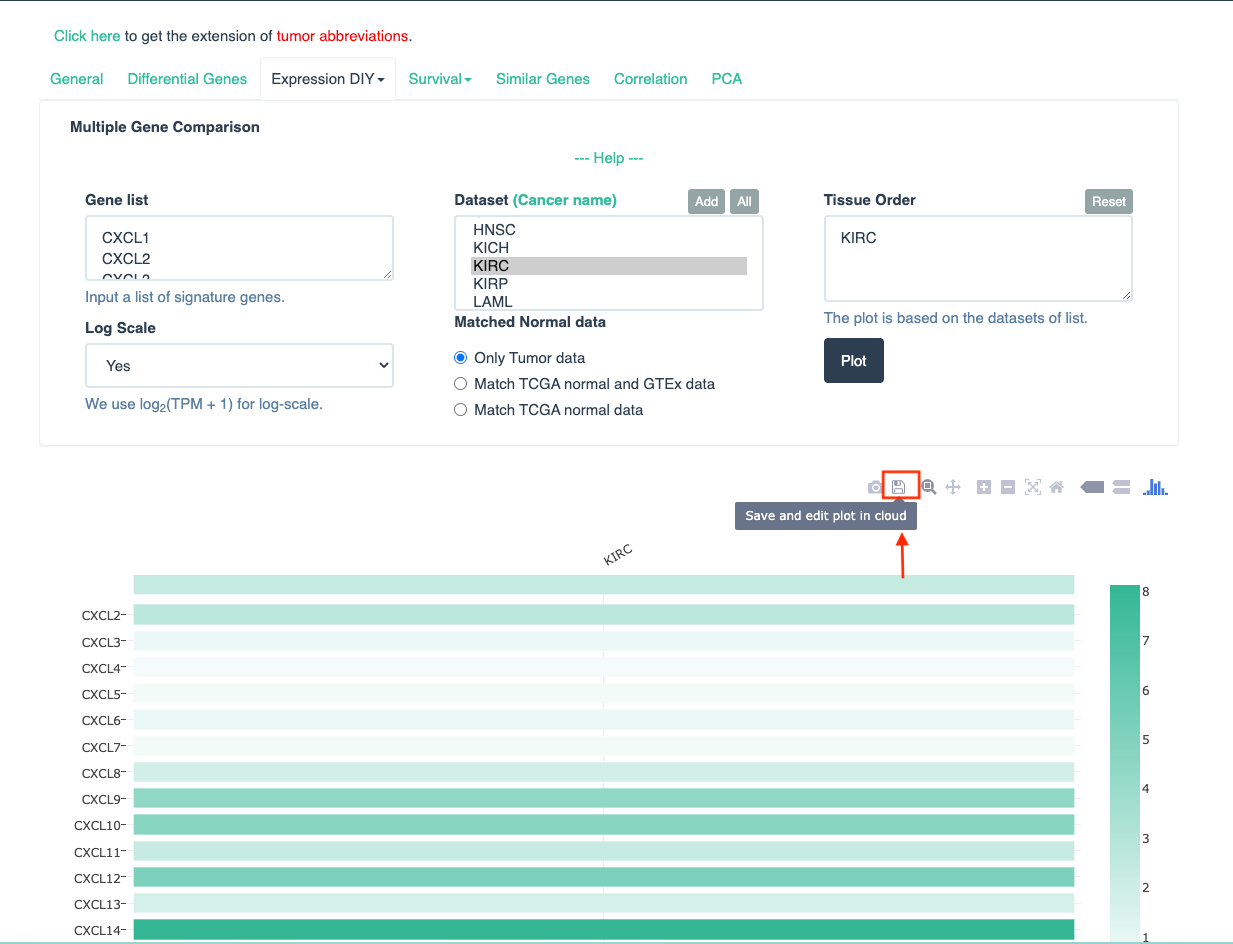
Plot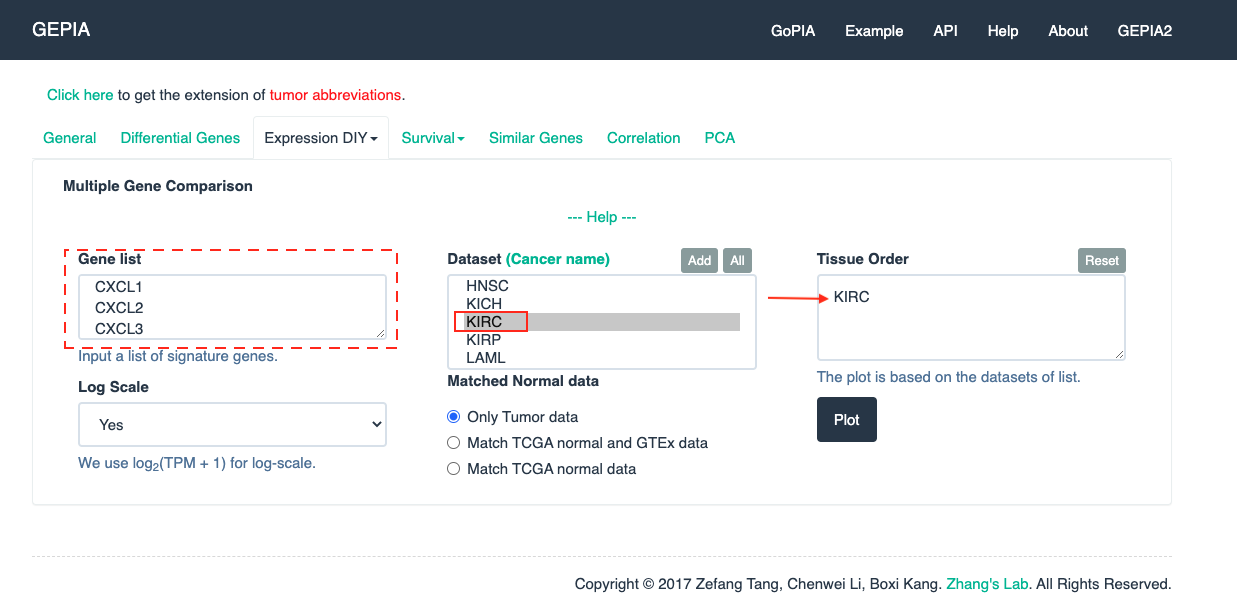
-
Save and edit plot in cloud
-
Click on
Heatmapto generate the final heatmap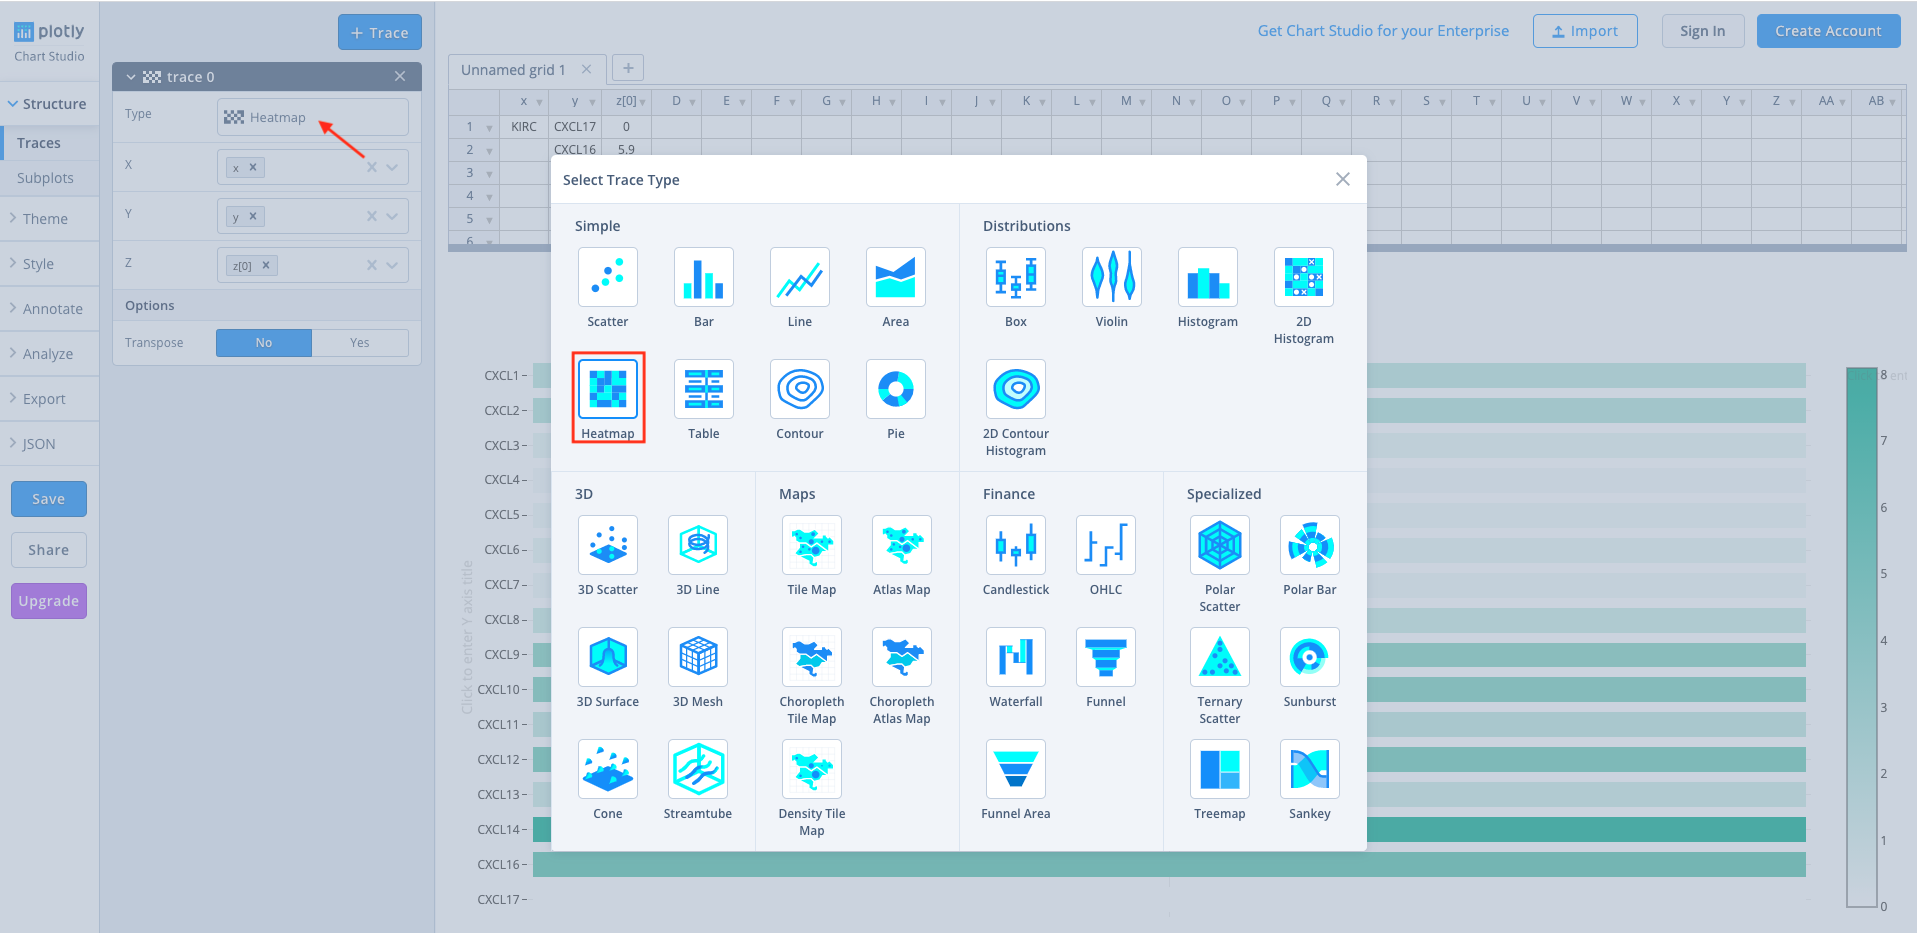
-
The relative expression of CXCL14 was the highest.
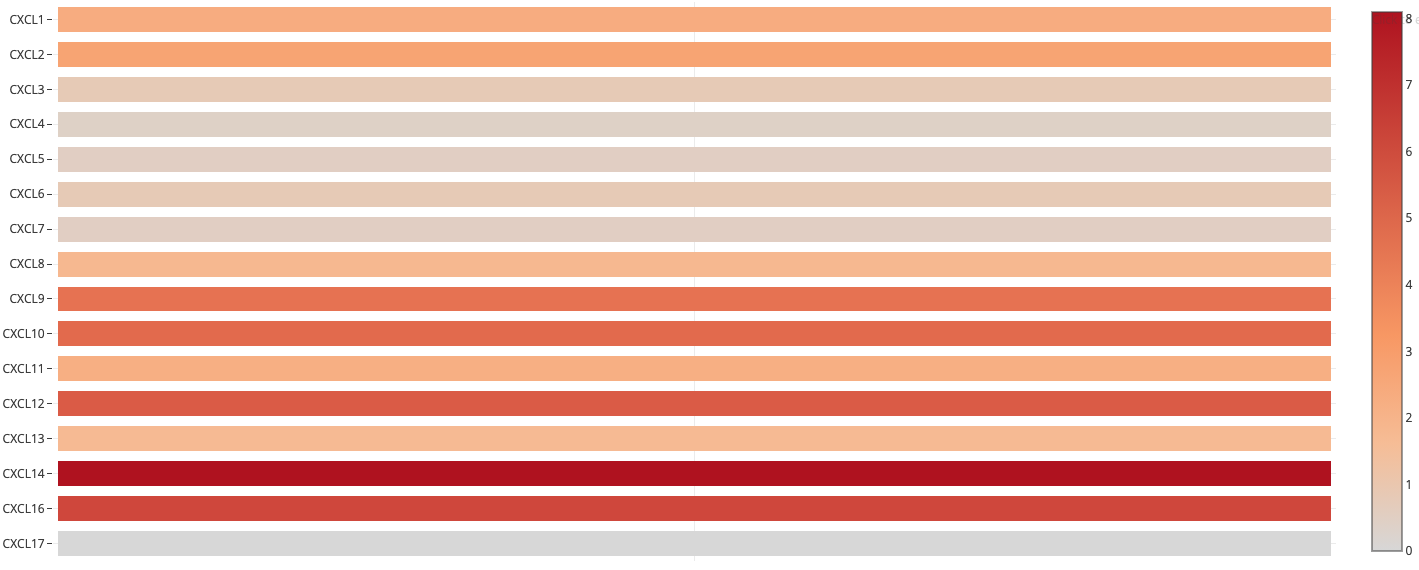
Figure 4. Correlation between different expressed CXC chemokines and the pathological stage of RCC patients (GEPIA)
-
Methods: GEPIA.
-
Open GEPIA
-
Click on
Expression DIY, chooseStage plot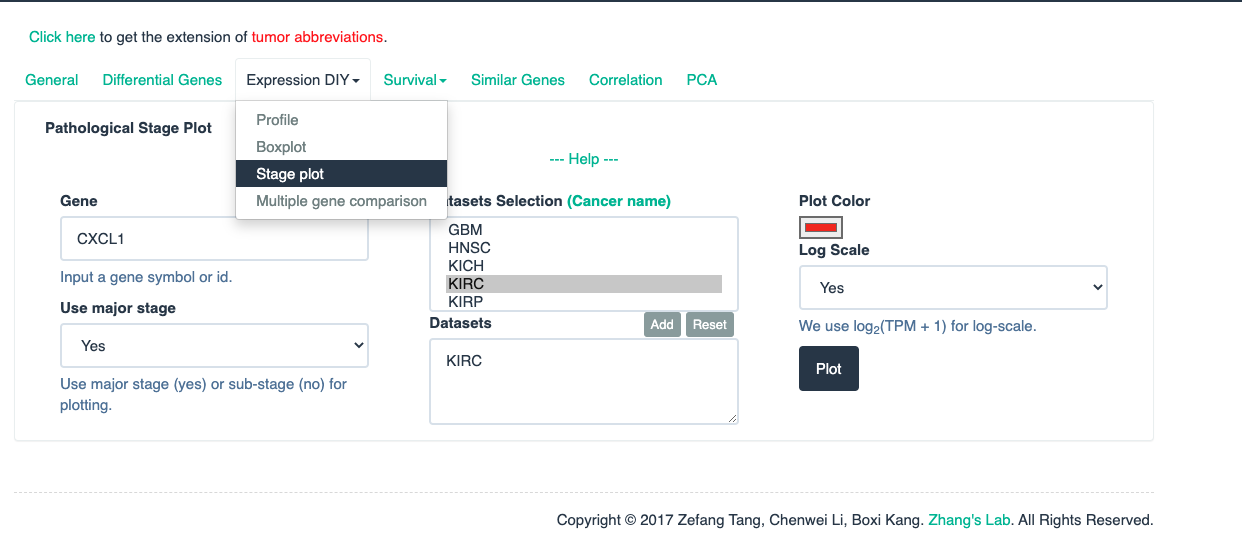
-
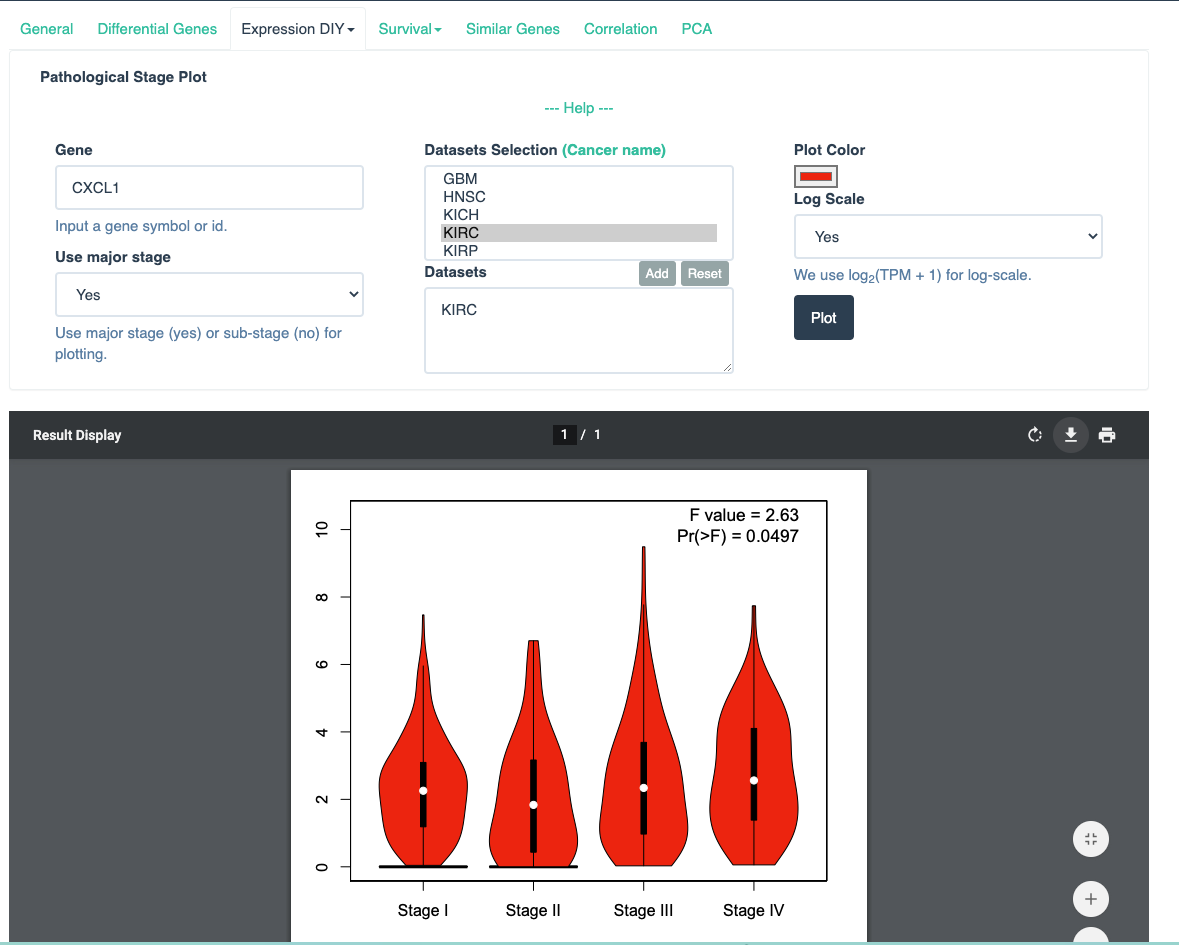
Set up the parameters for CXCL1 gene and click the button
Plot -
Generate result of CXCL1 gene.
-
Merge all results of CXC chemokines together with Google Slides.
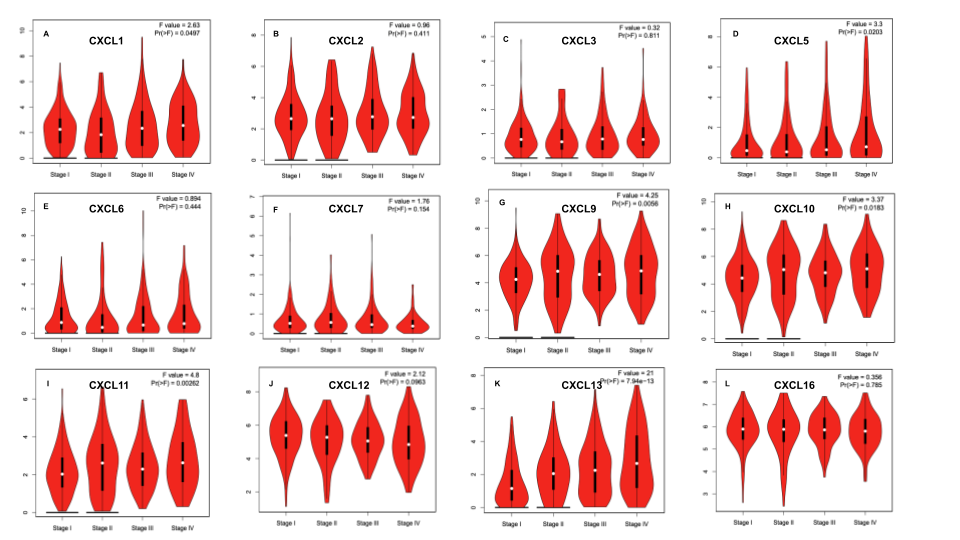
Figure 5. The prognostic value of different expressed CXC chemokines in RCC patients in the disease free survival curve (GEPIA)
-
Methods: GEPIA.
-
Open GEPIA
-
Click
Survivaland chooseSurvival Plots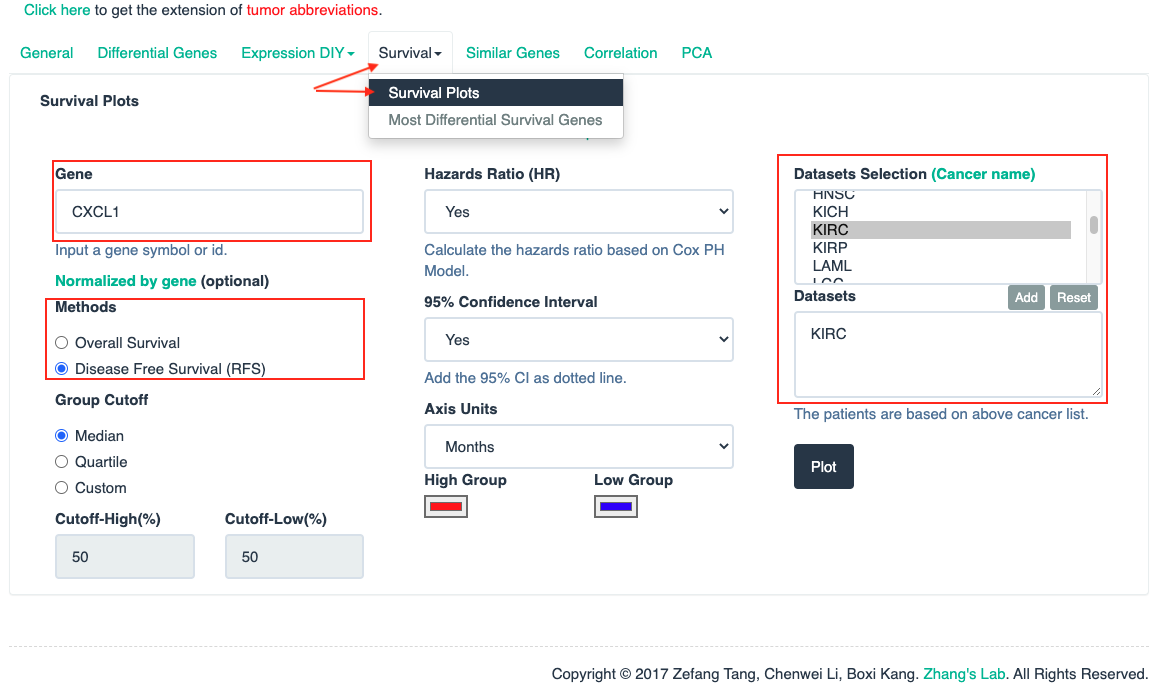
-
Set up the parameters for CXCL1 gene and click the button
Plot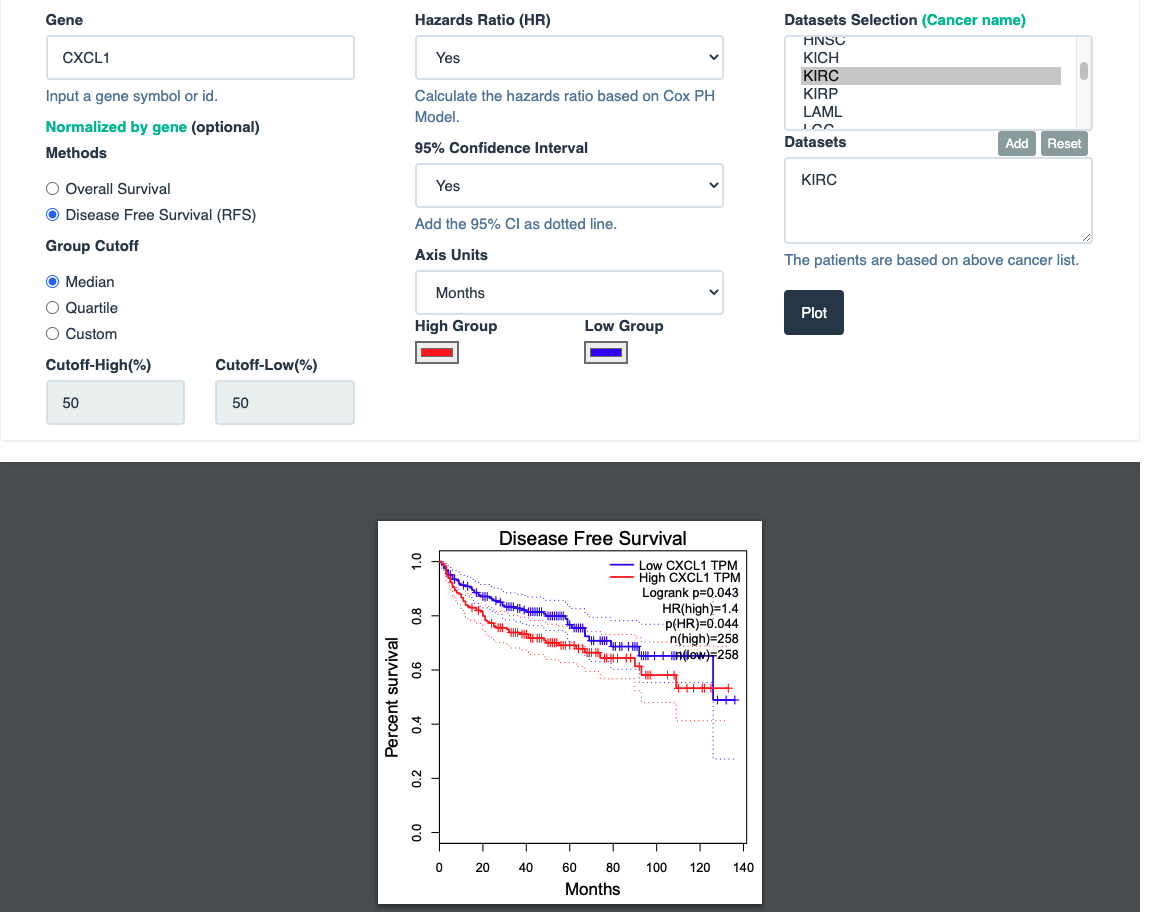
-
Generate result of CXCL1 gene
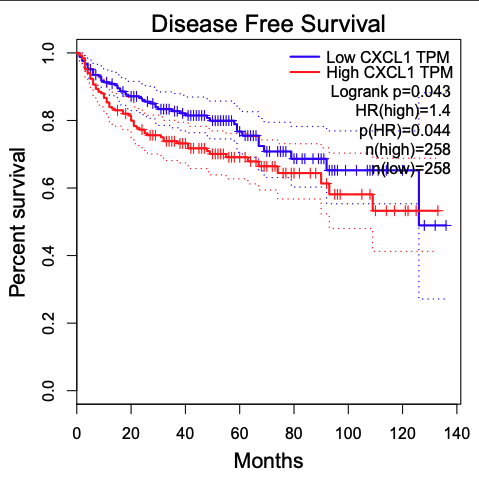
-
Merge all results of CXC chemokines together with Google Slides.
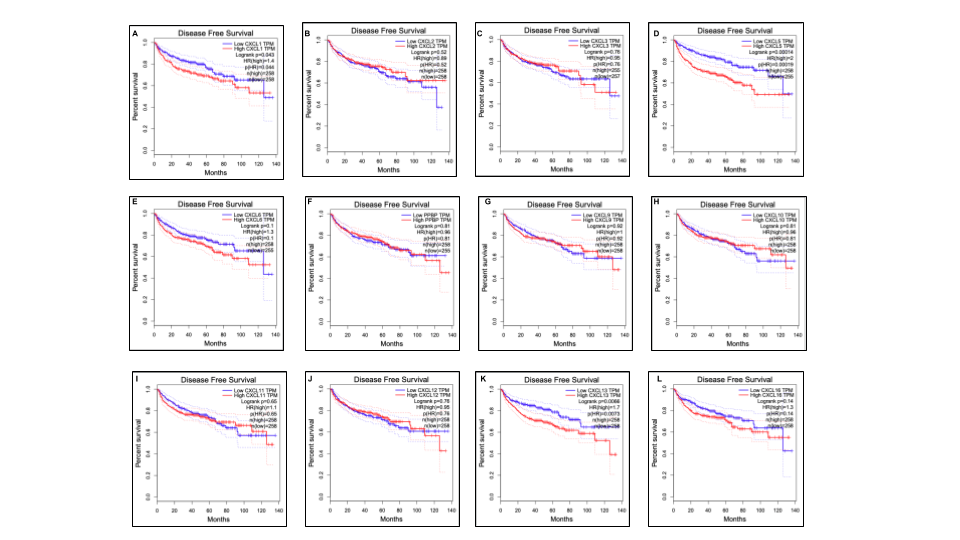
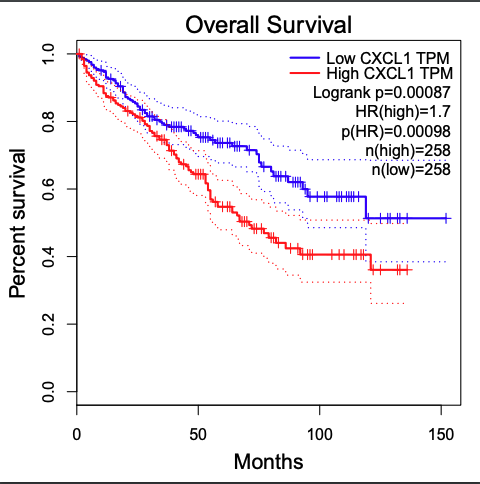
Figure 6. The prognostic value of CXC chemokines in RCC patients in the overall survival curve (GEPIA)
-
Methods: GEPIA.
-
Open GEPIA
-
Click
Survivaland chooseSurvival Plots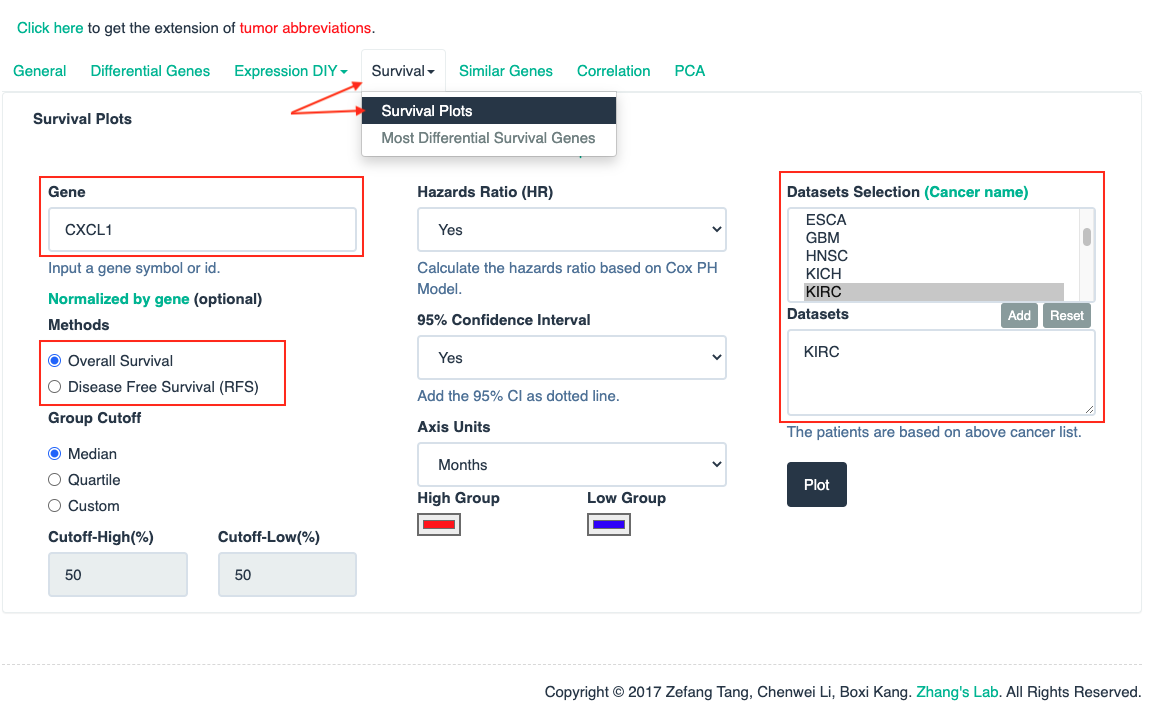
-
Set up the parameters for CXCL1 gene and click the button
Plot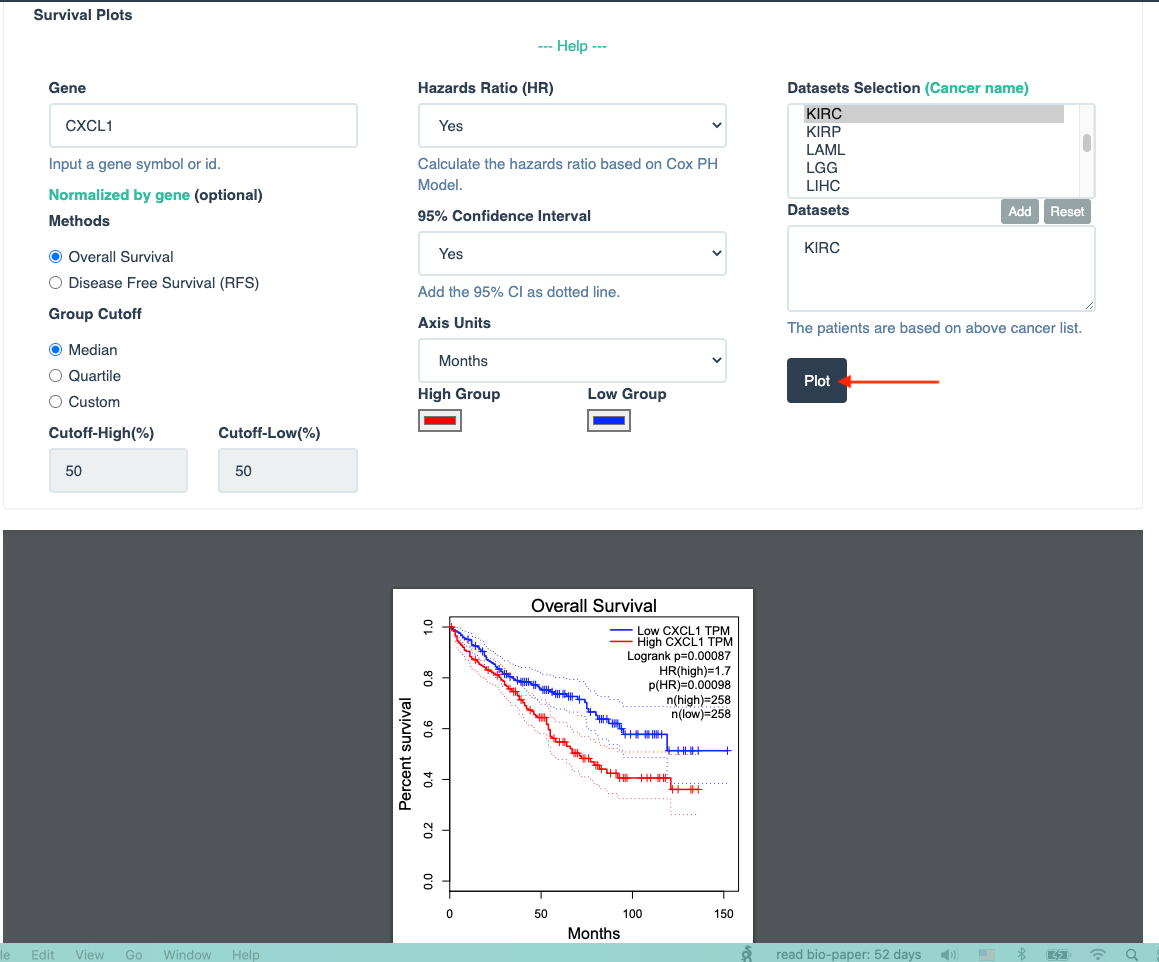
-
Generate result of CXCL1 gene
-
Merge all results of CXC chemokines together with Google Slides.
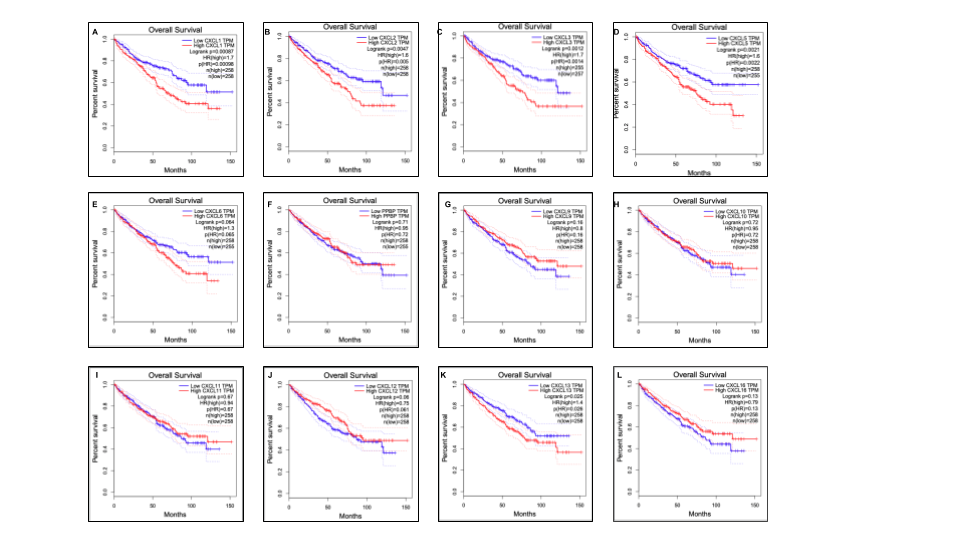
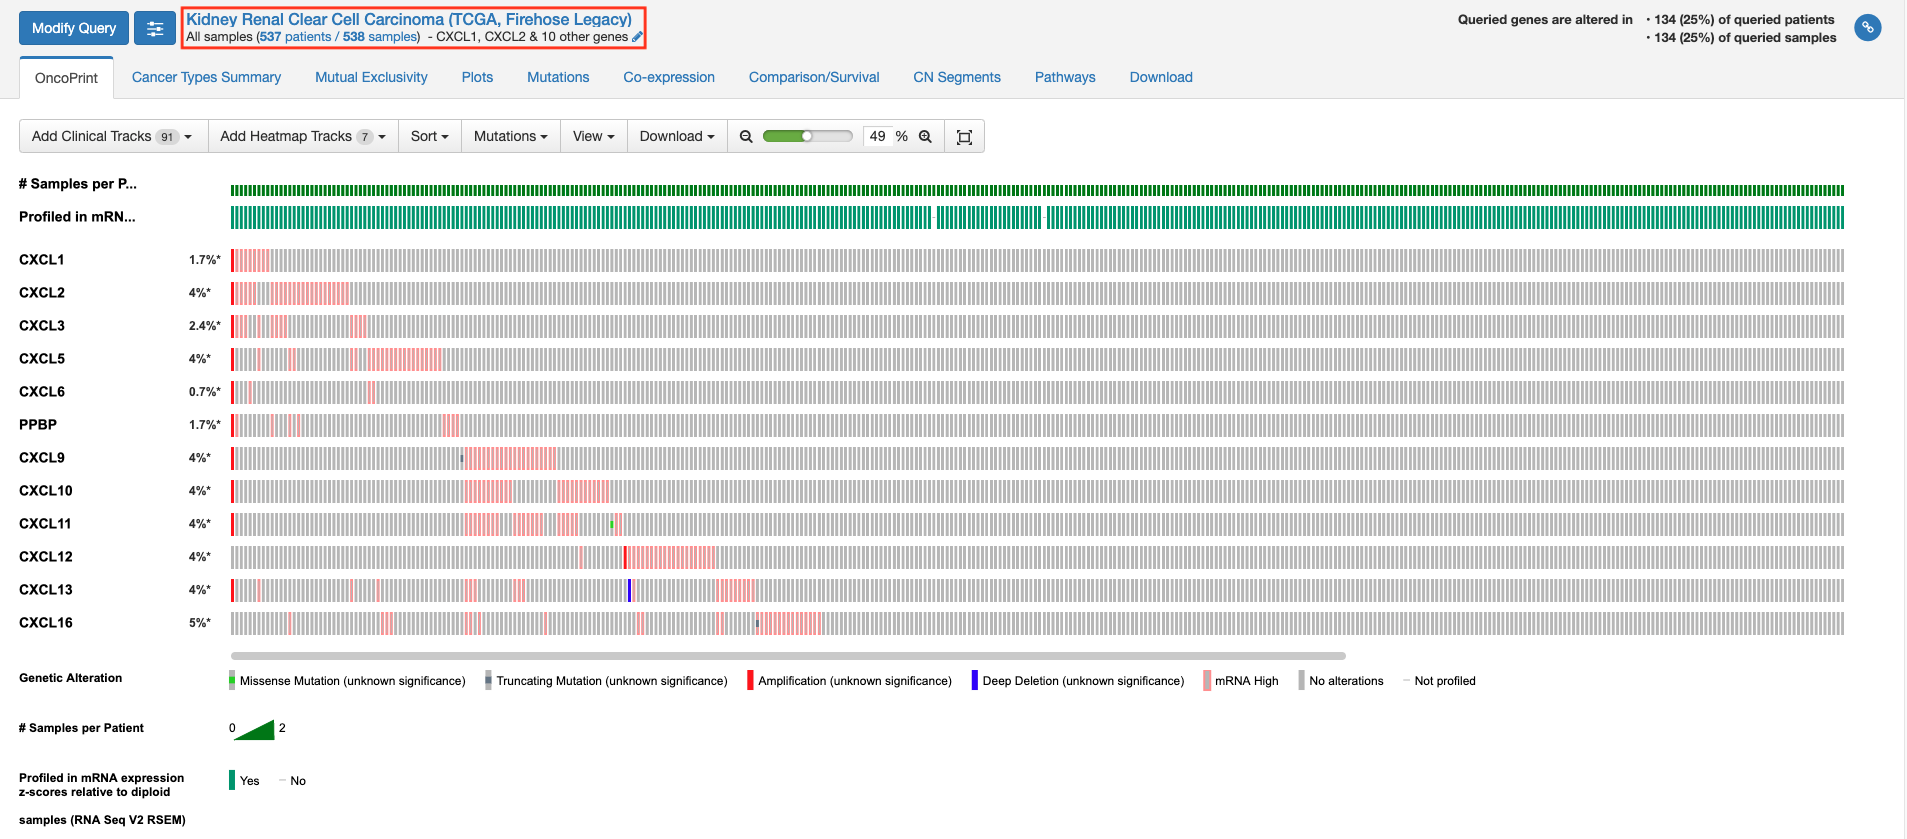
Figure 7. Genetic alteration, neighbor gene network, and interaction analyses of different expressed CXC chemokines in RCC patients
-
Methods: cBioportal.
-
Open cBioportal
-
Set up the parameters and click the button
Submit Query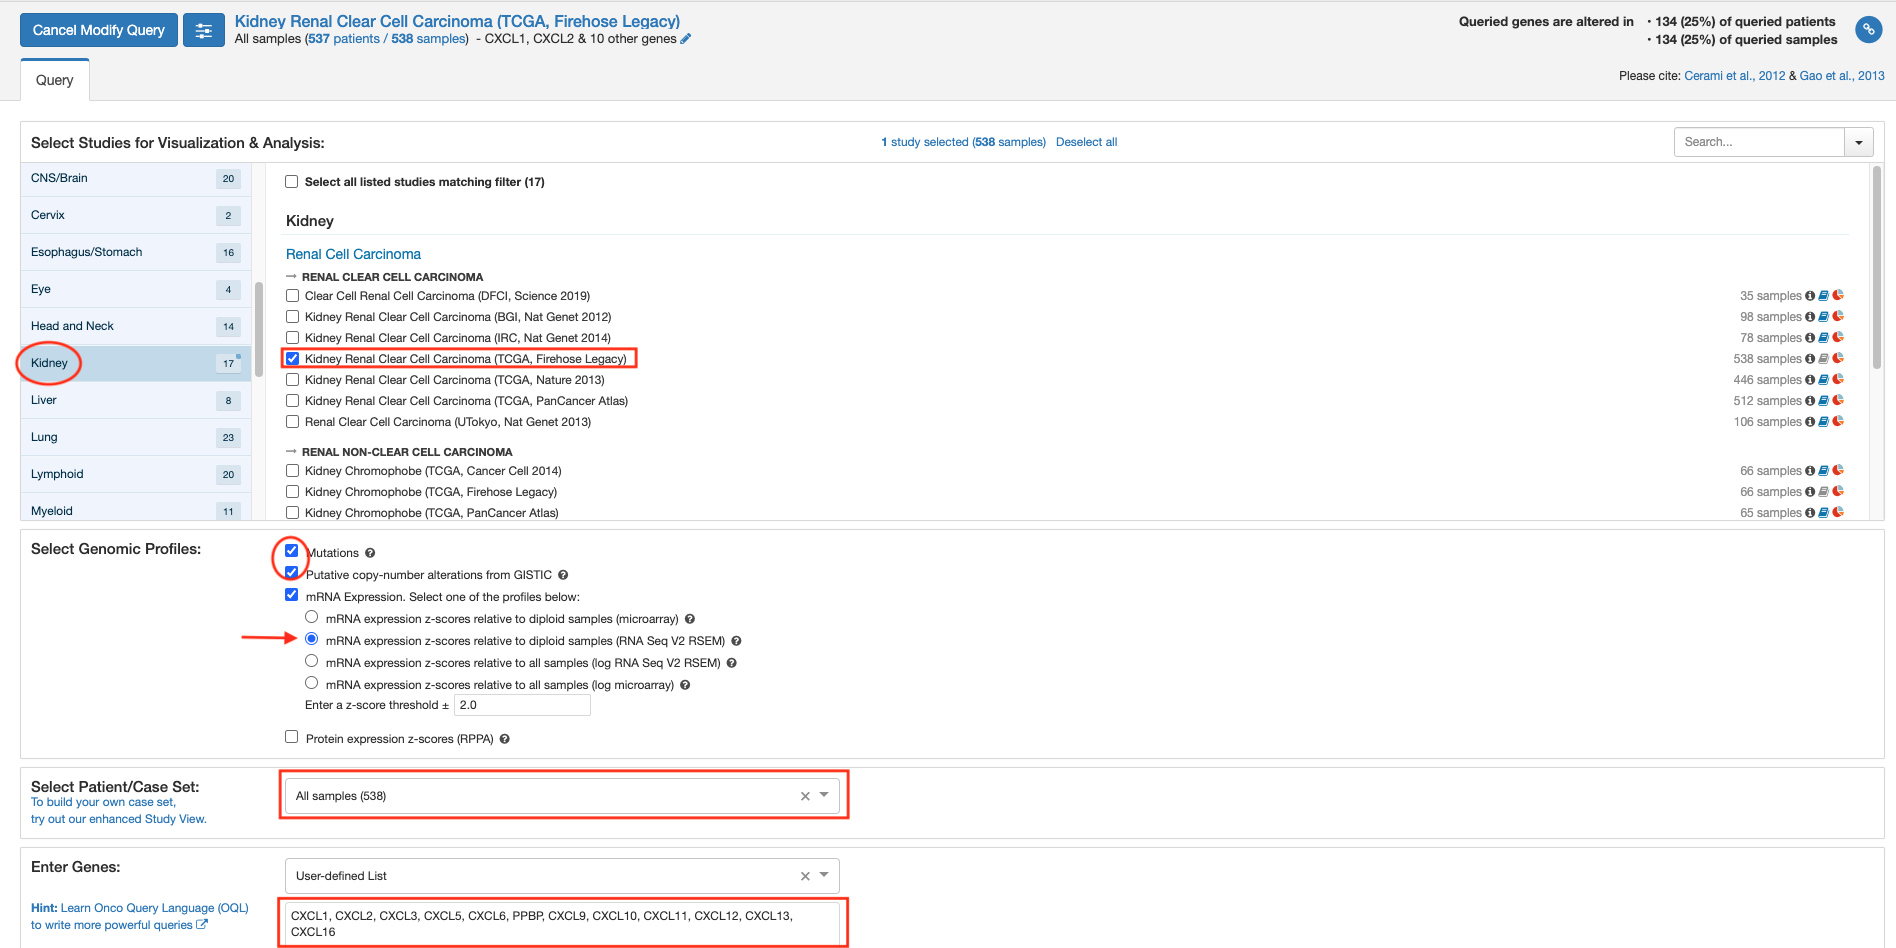
-
Generate result for Figure 7A.
-
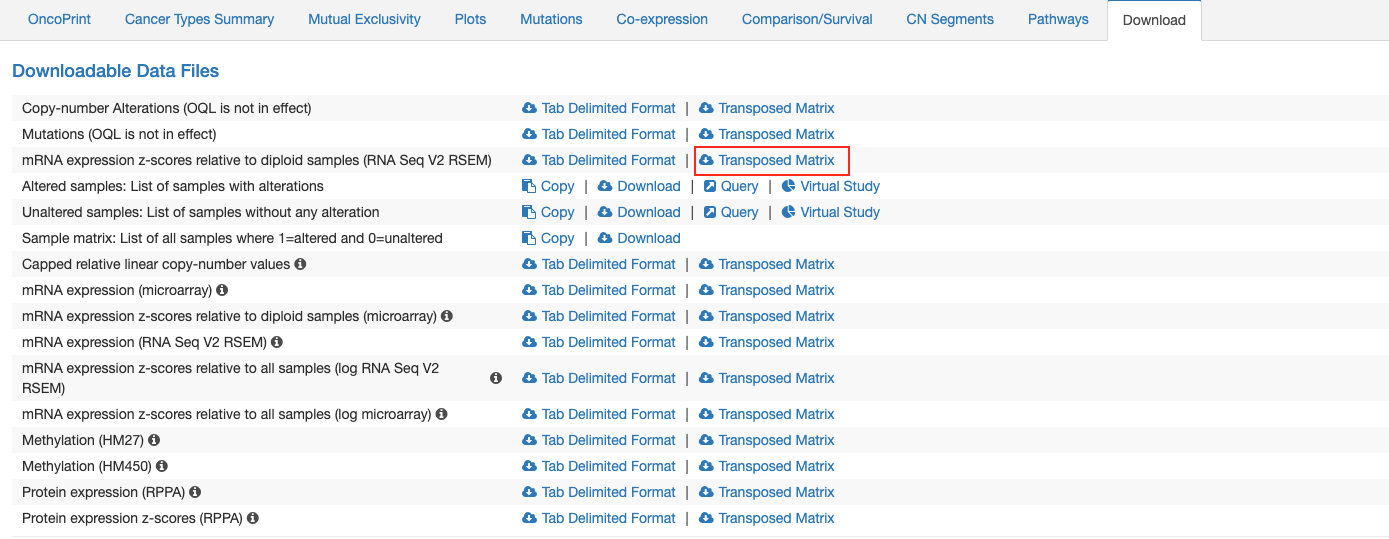
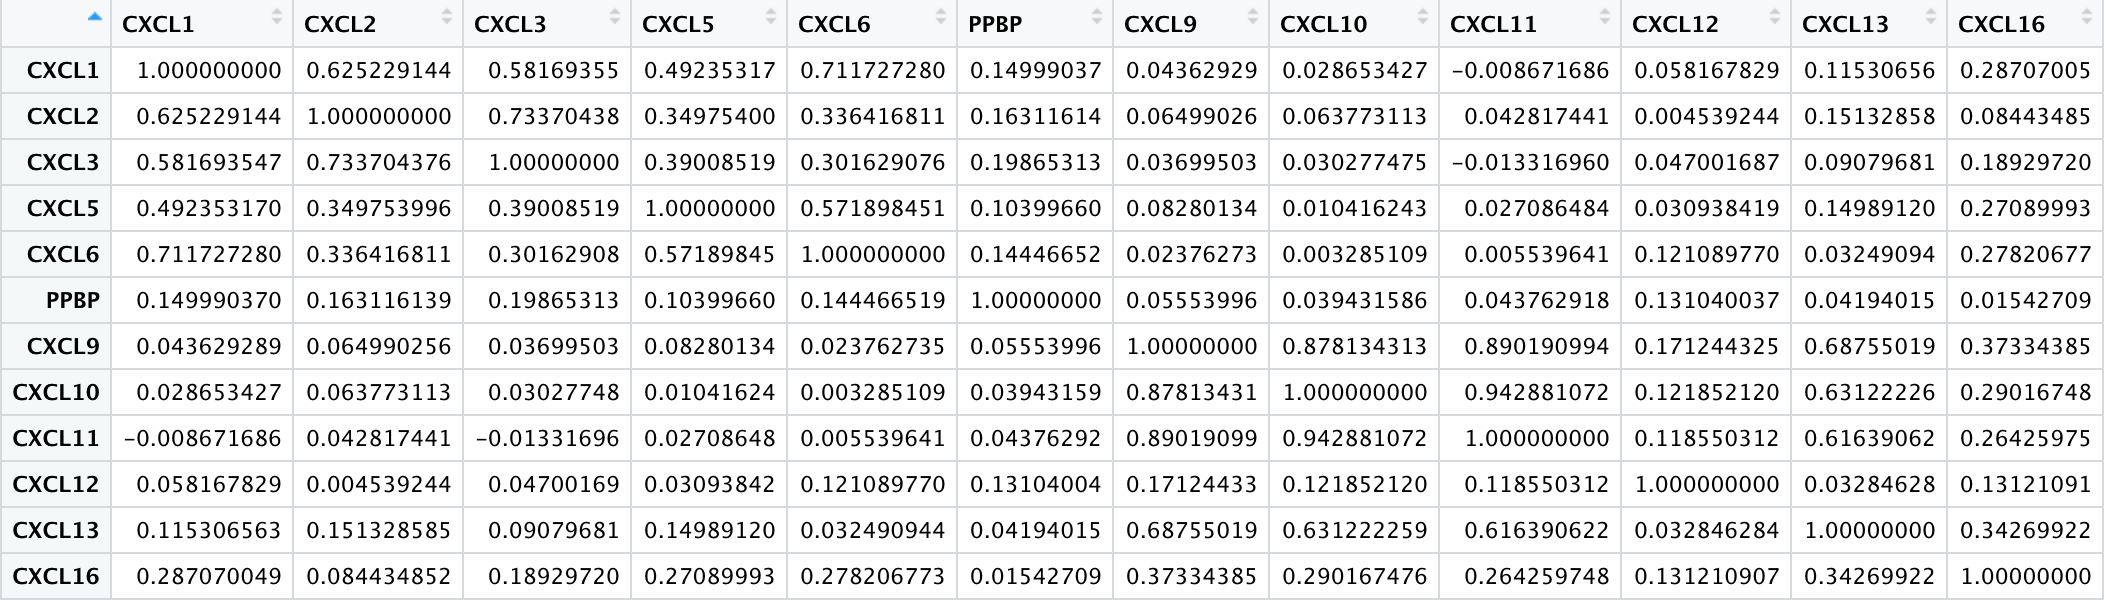
Download the mRNA expression z-scores relative to diploid samples (RNA Seq V2 RSEM) and save.
-
To get the correlation heat map of different expressed CXC chemokines in RCC with R.Script.
-
Methods: STRING.
-
Opne STRING
-
Set up the parameters and click on the button
SEARCH.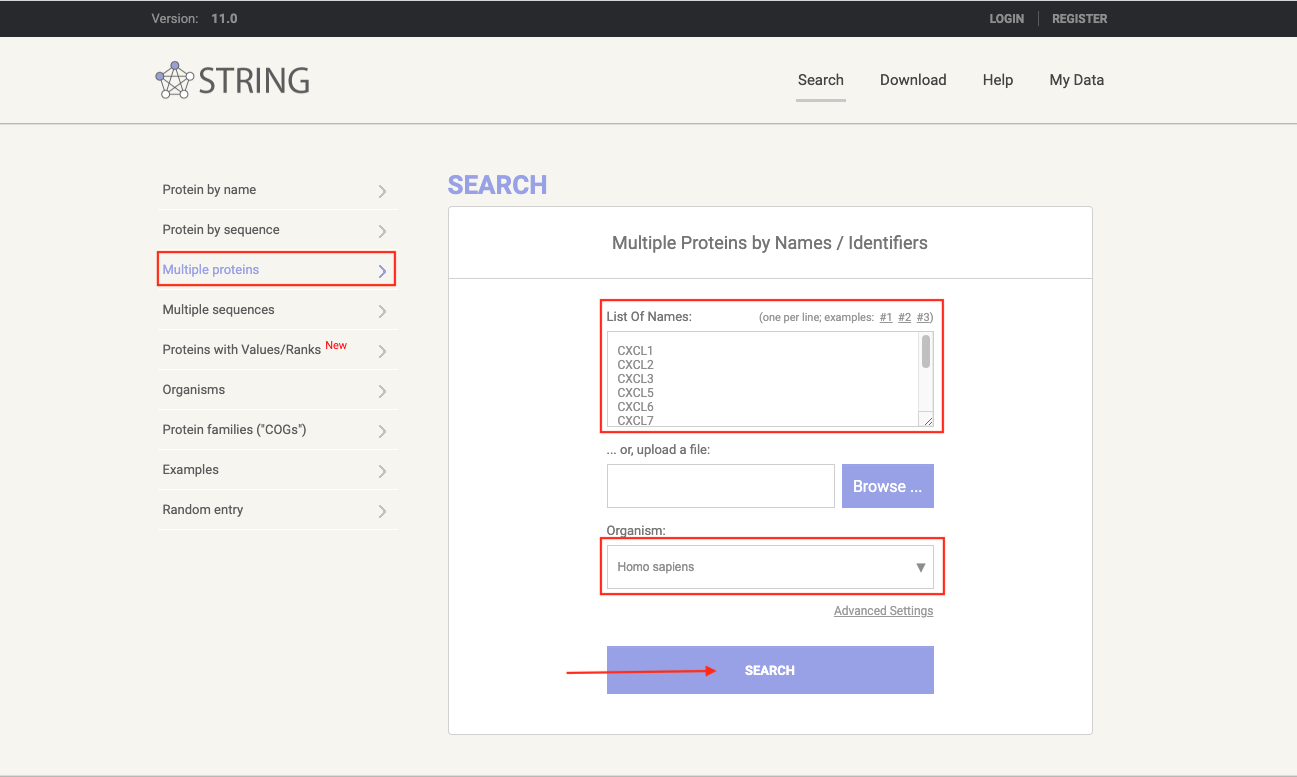
-
Continue, click on the button
CONTINUE>>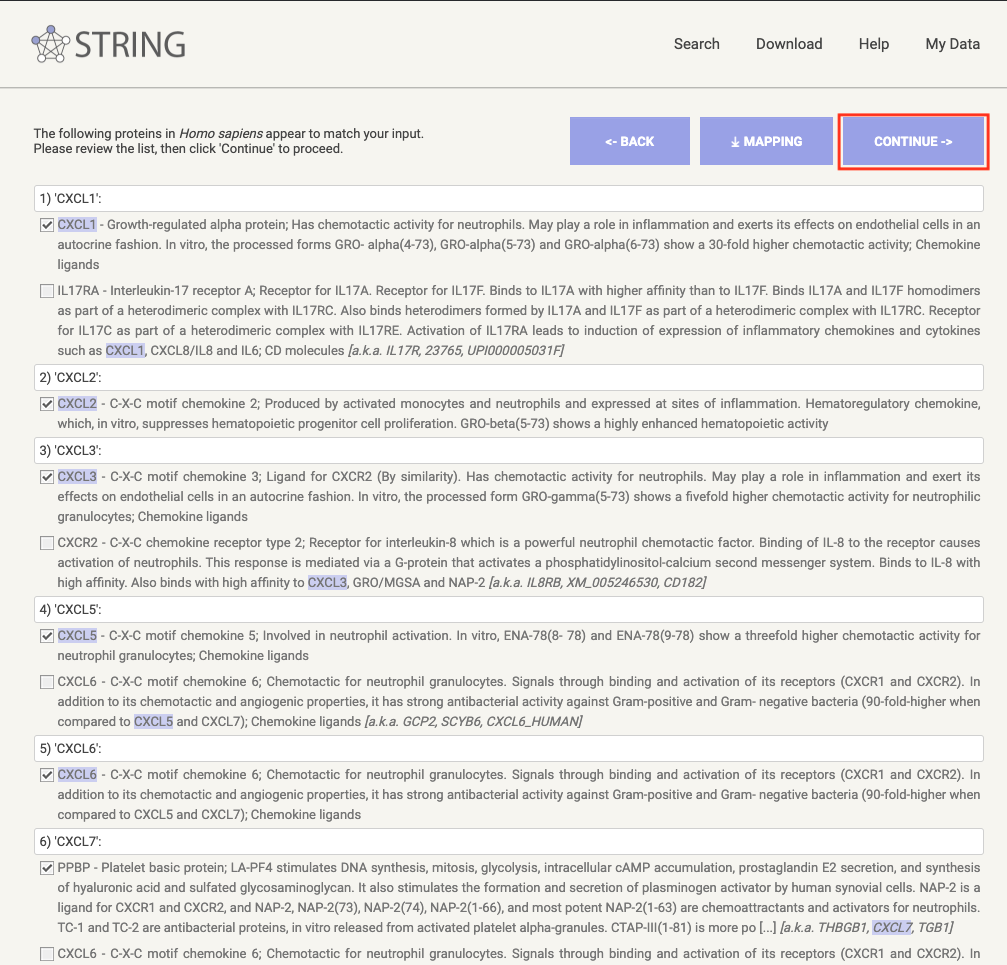
-
Click on the button
Exports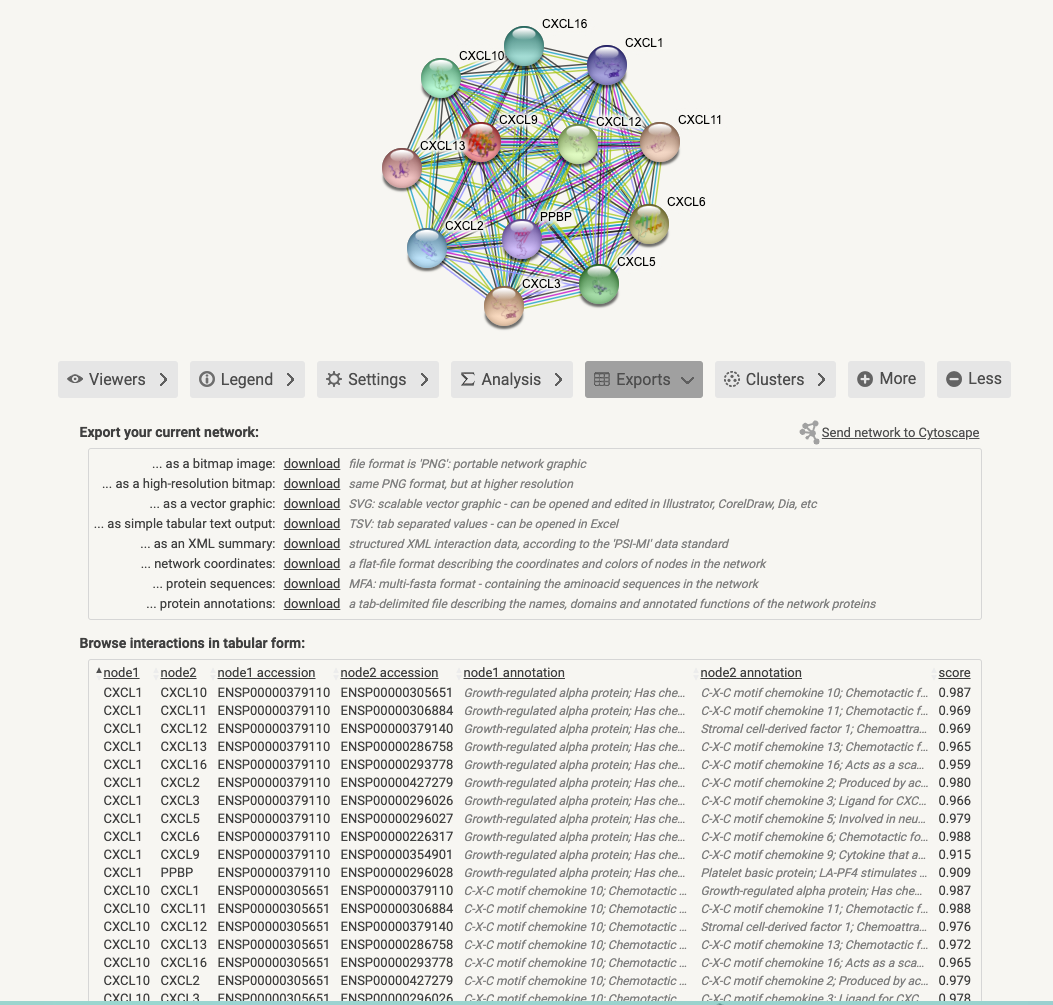
-
Click on the button
Exportsand download the result of Fig7C.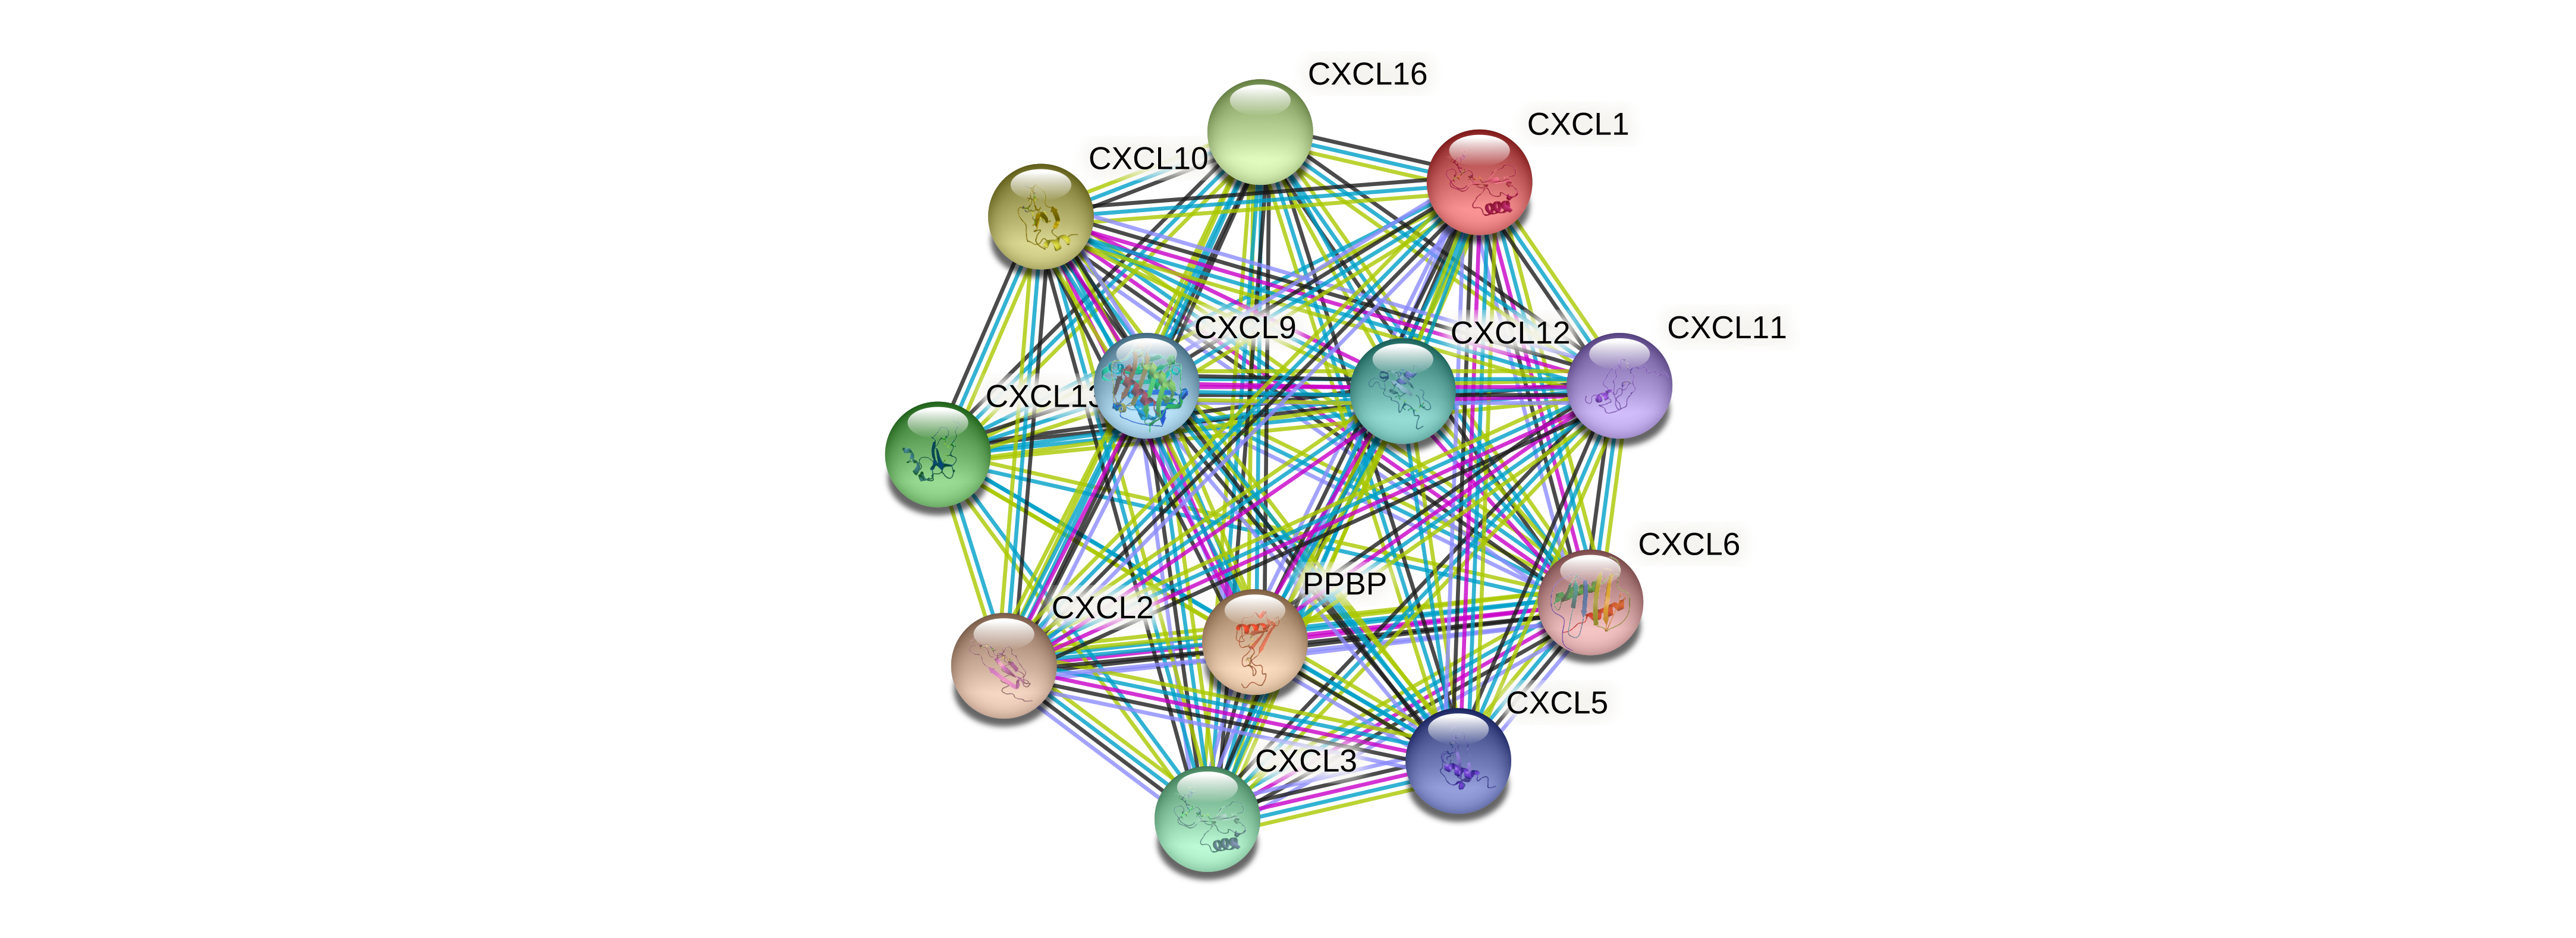
-
Open GeneMANIA
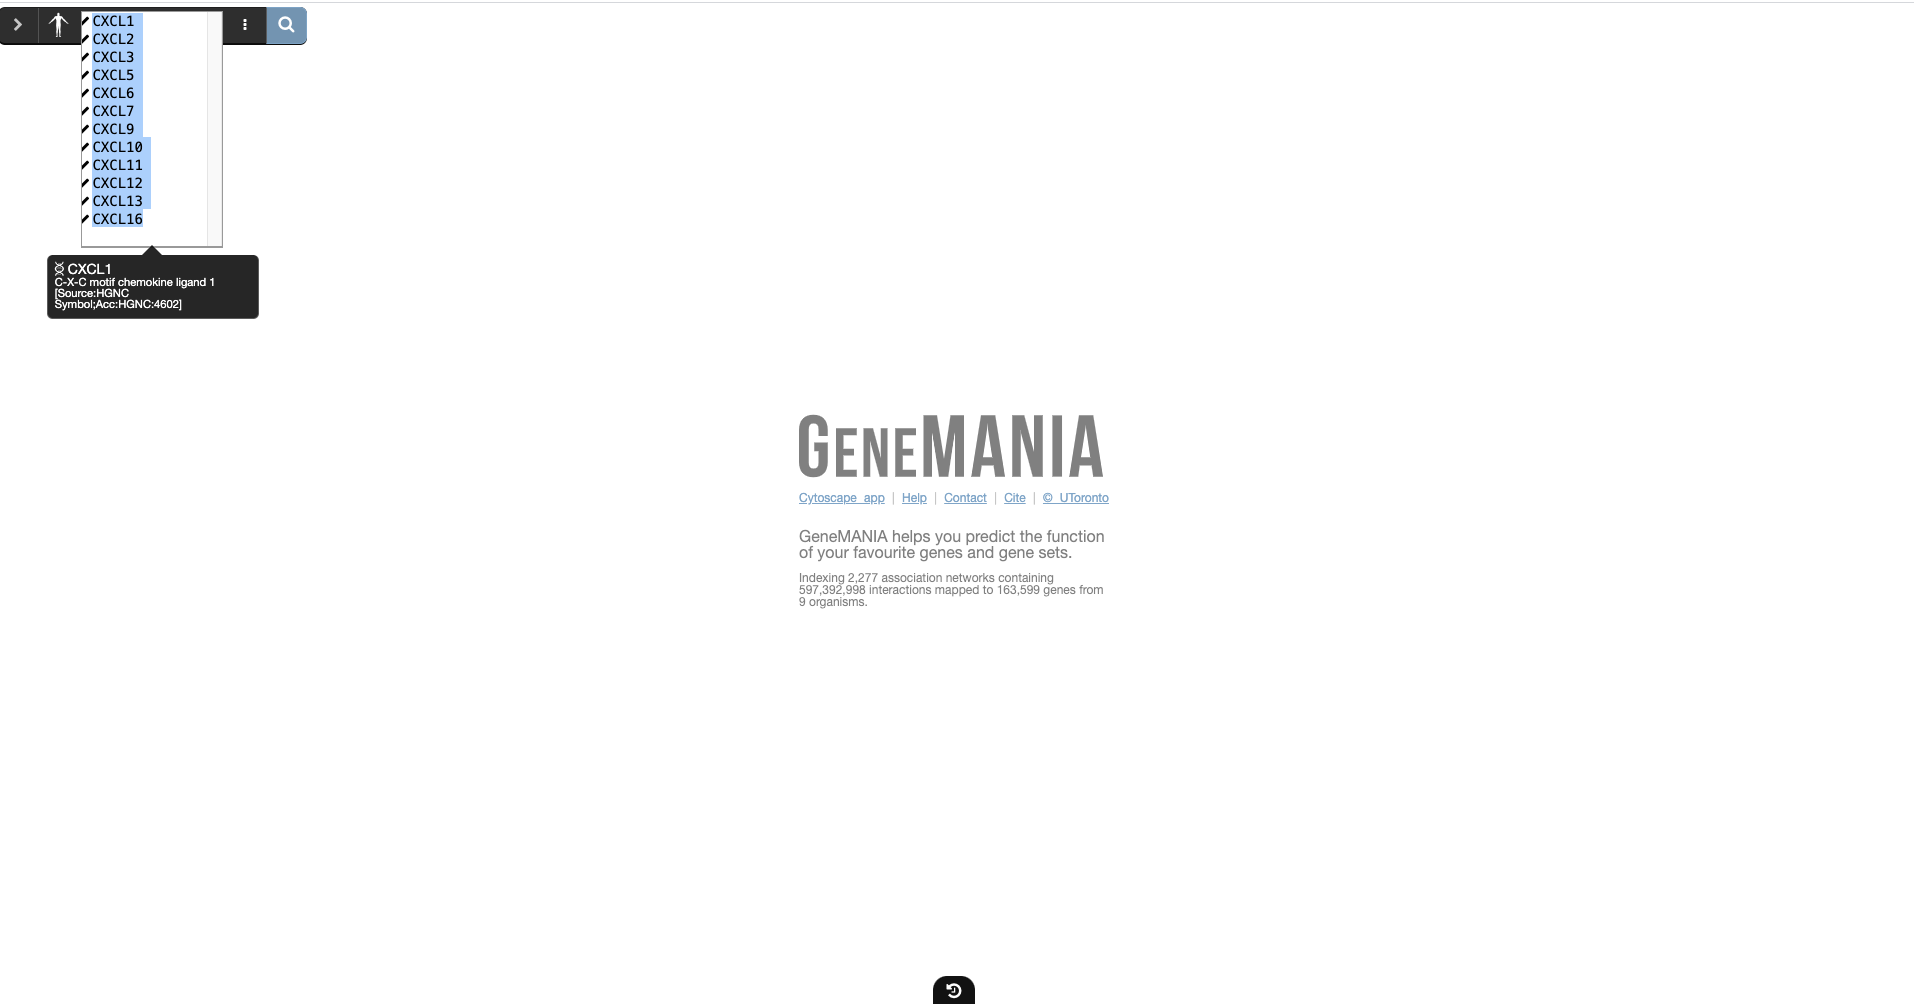
-
Enter gene list and click search icon
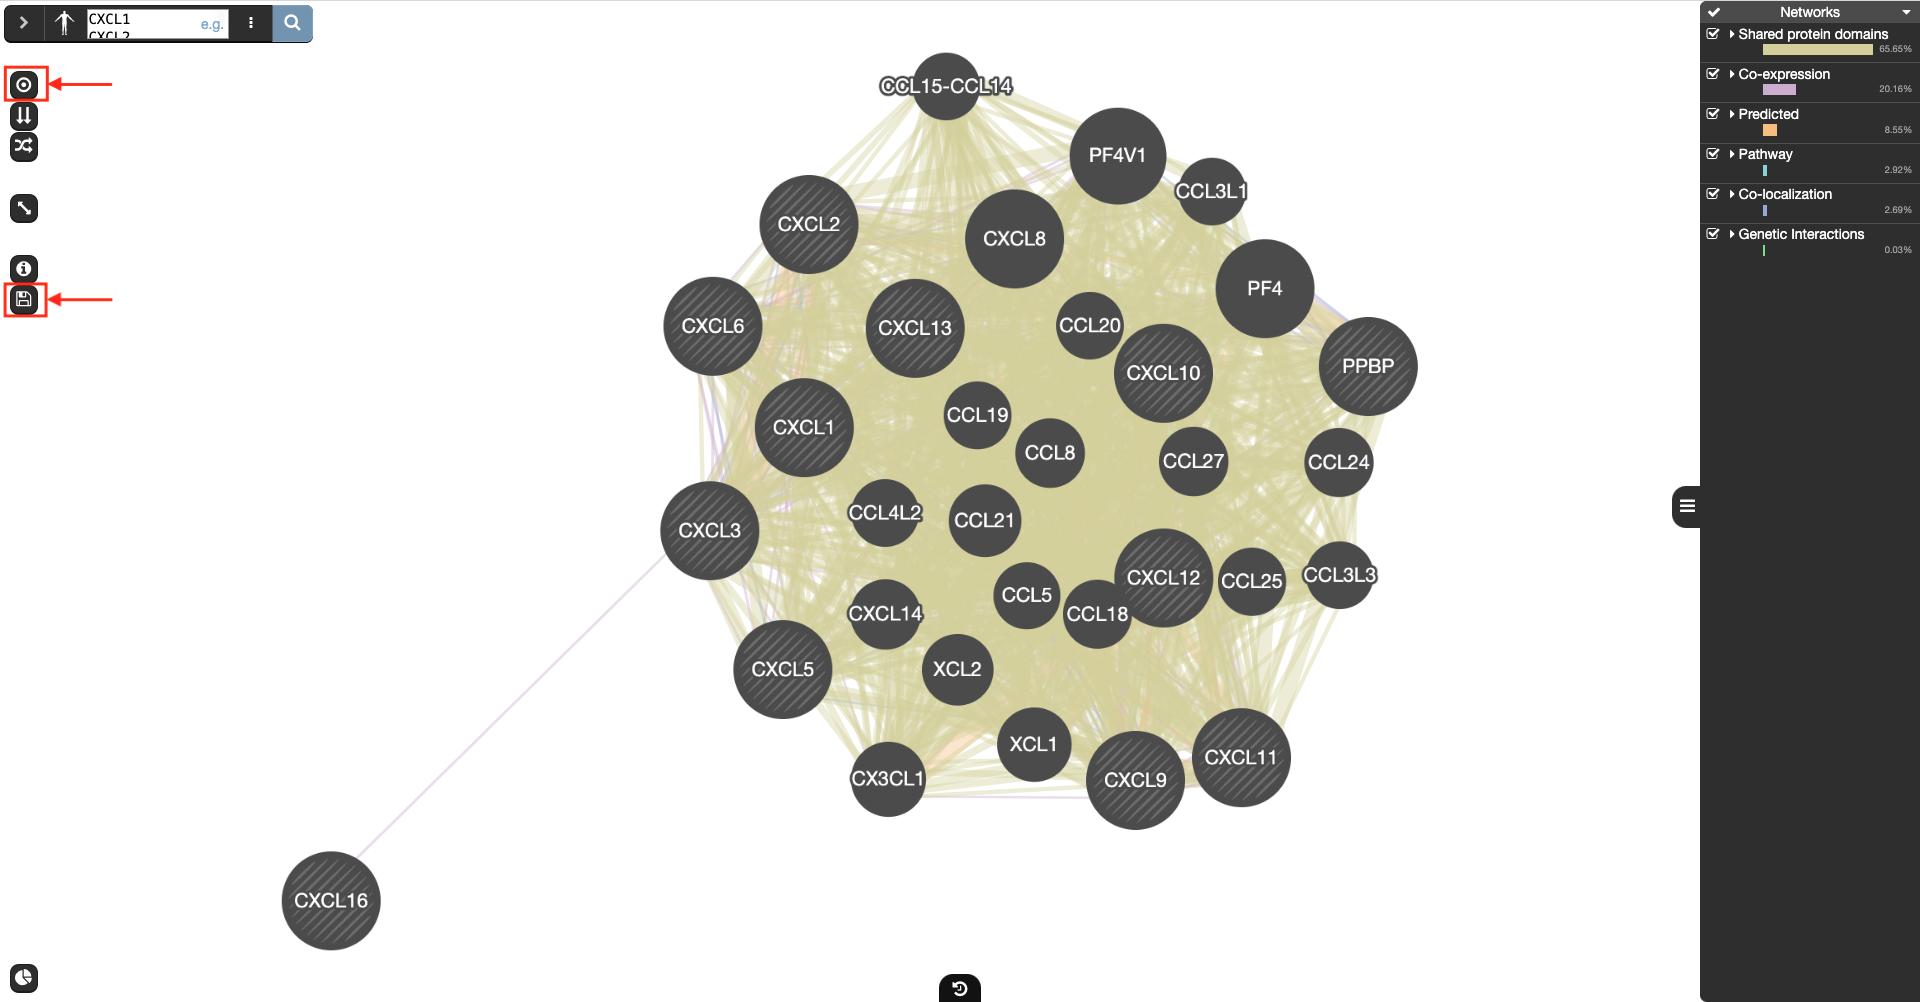
-
Click on the style icon and then click on the save icon to get the result of Fig7D.
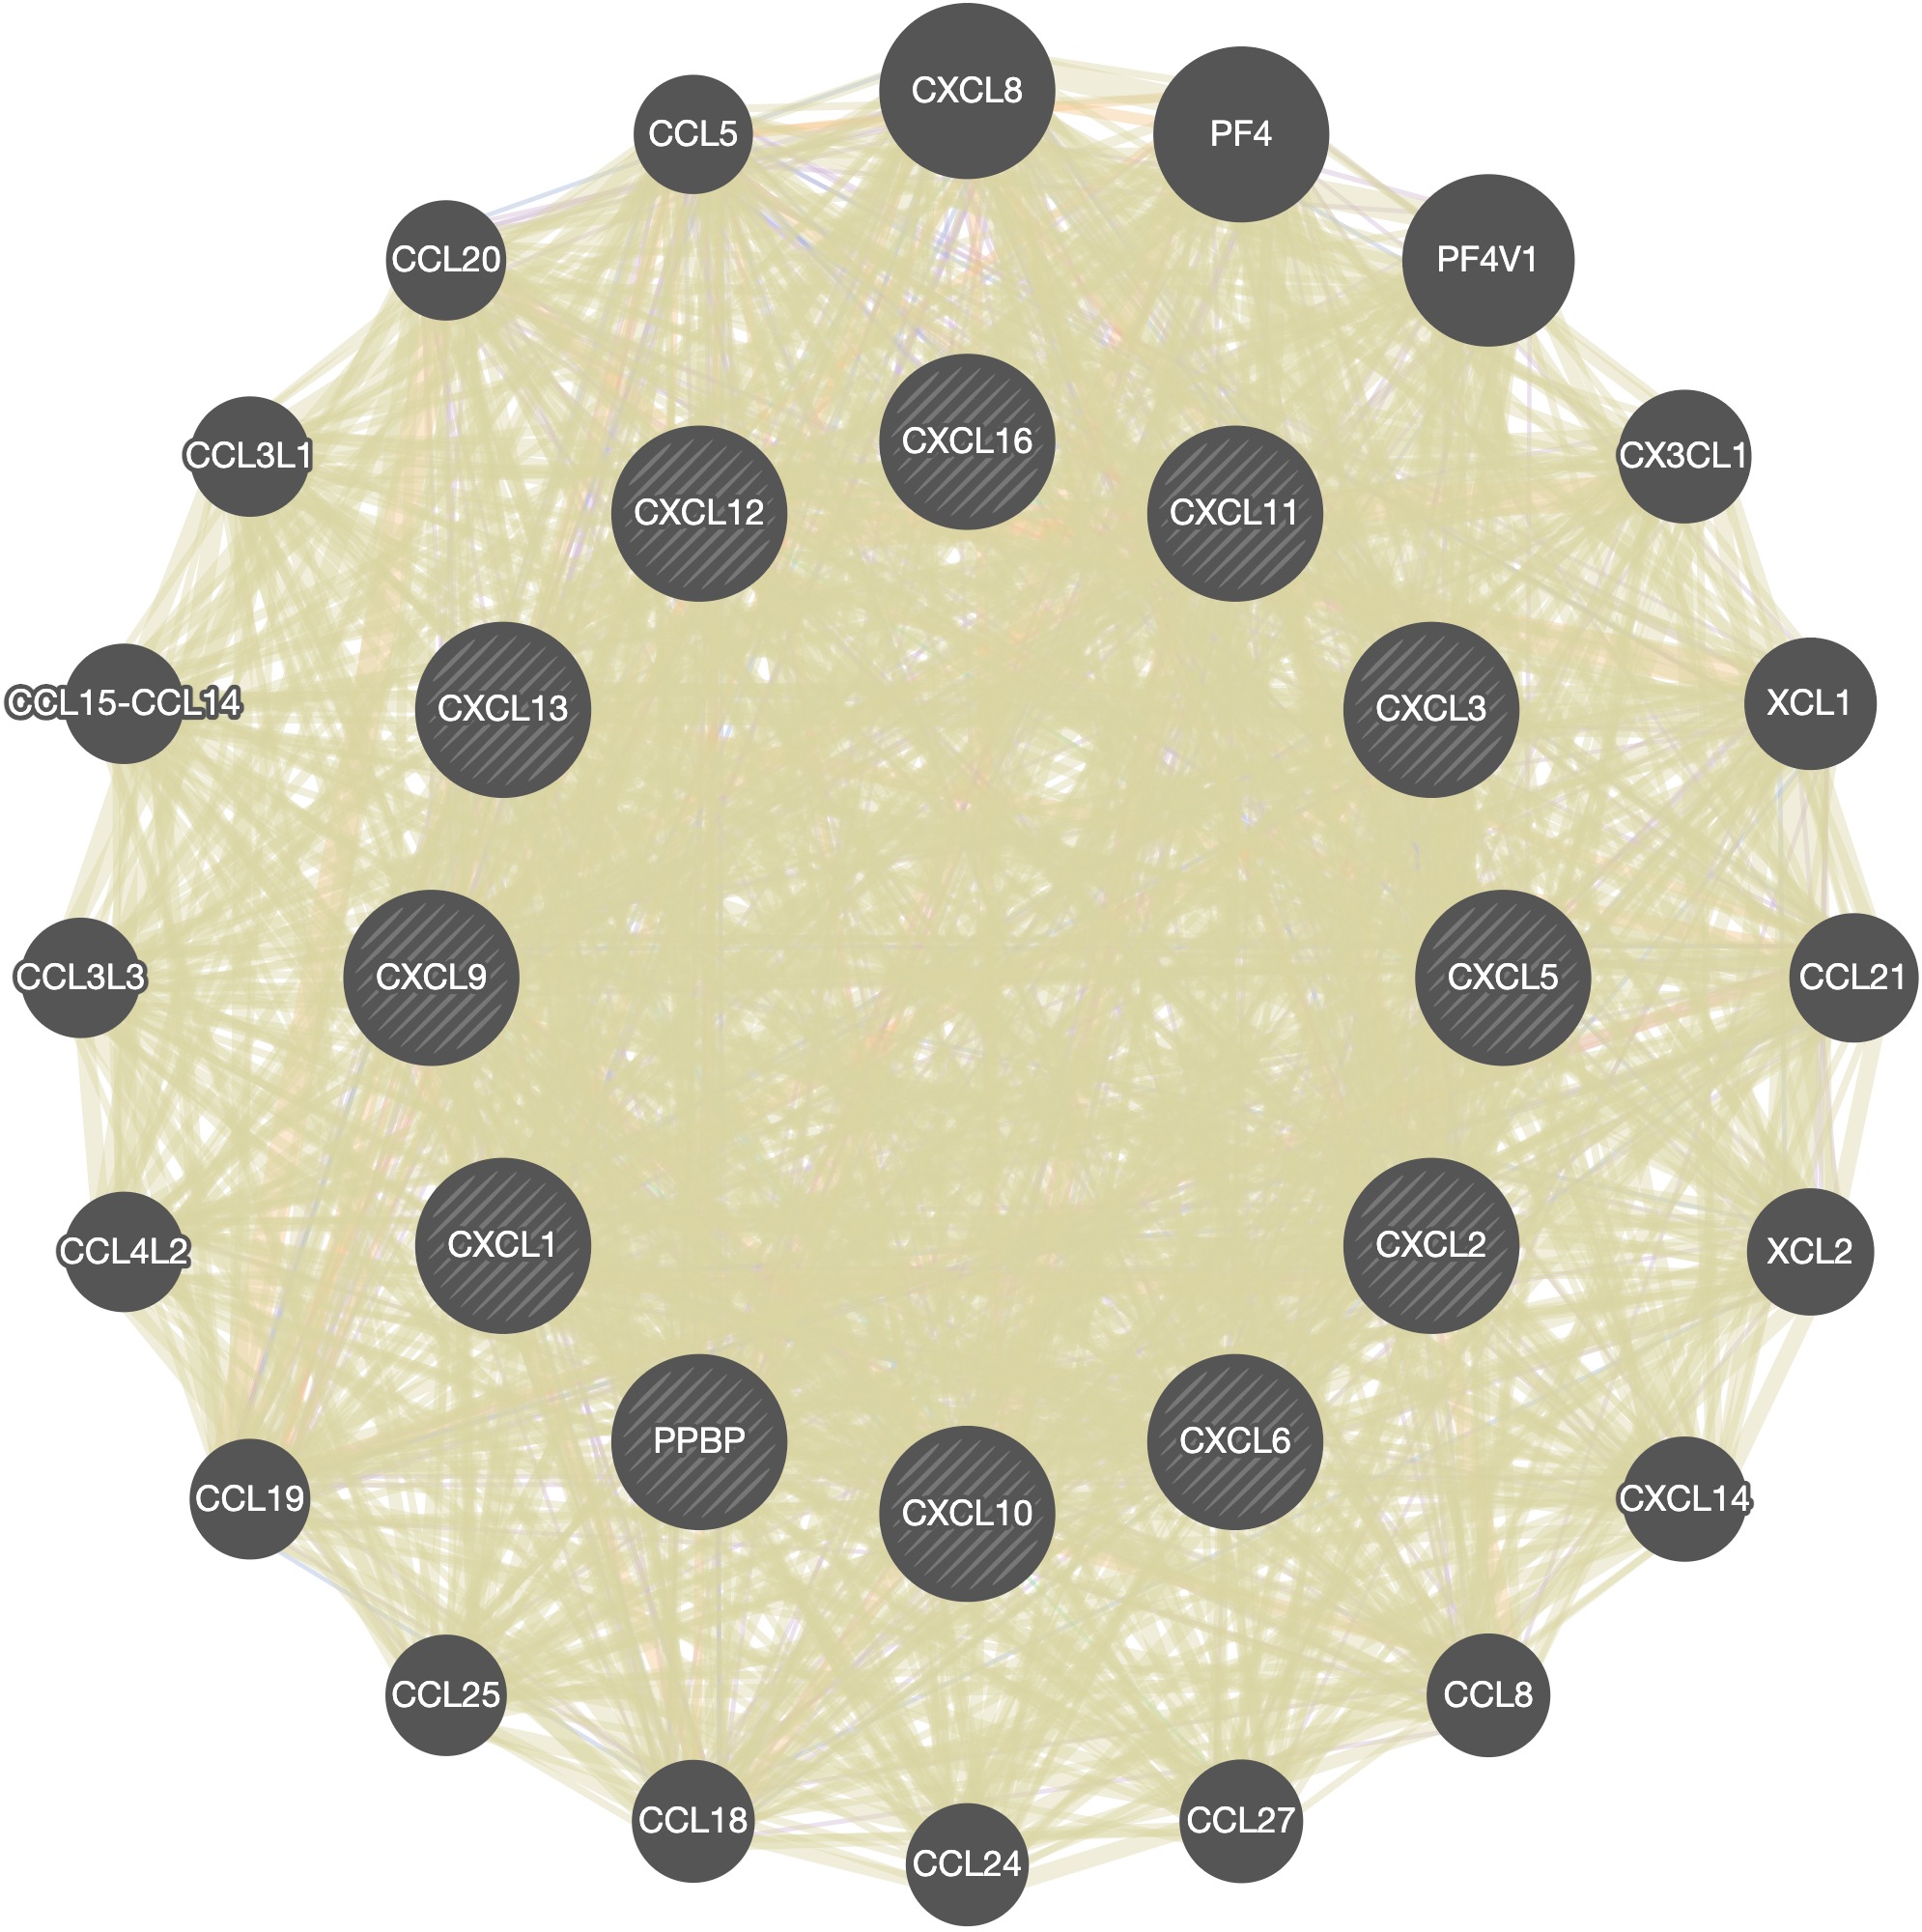
Table 2. Key regulated factor of CXC chemokines in RCC (TRRUST)
-
Methods: TRRUST.
-
Open TRRUST
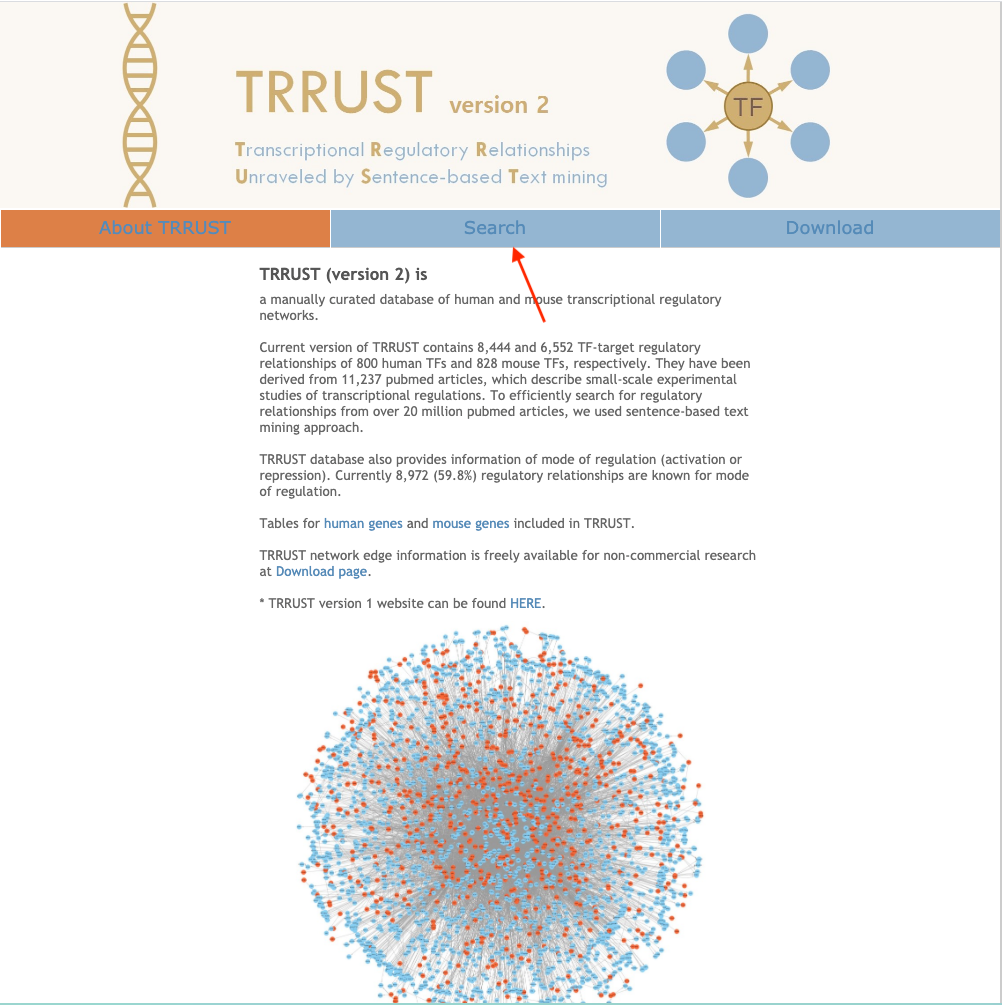
-
Entet query genes and setup parameters, and then click on the button
Submit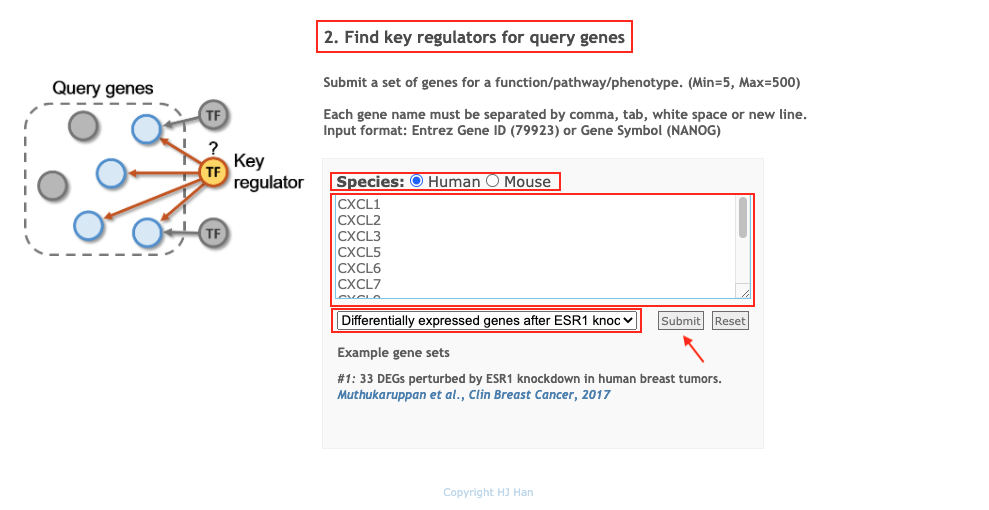
-
Generate the result
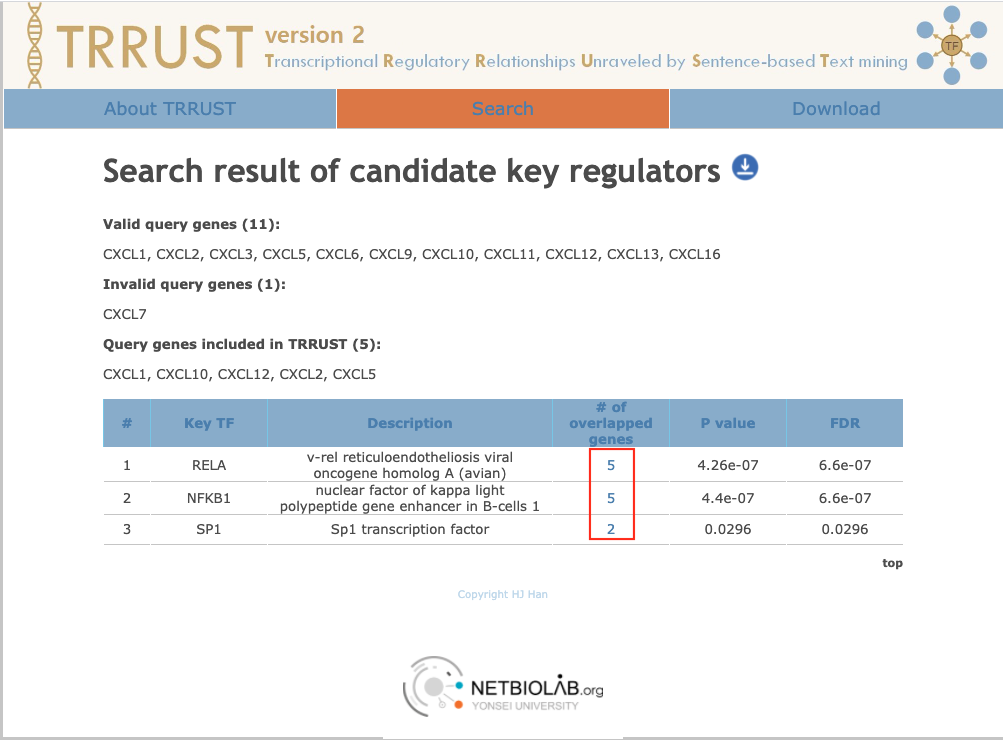
-
Click on the relative number to check the details
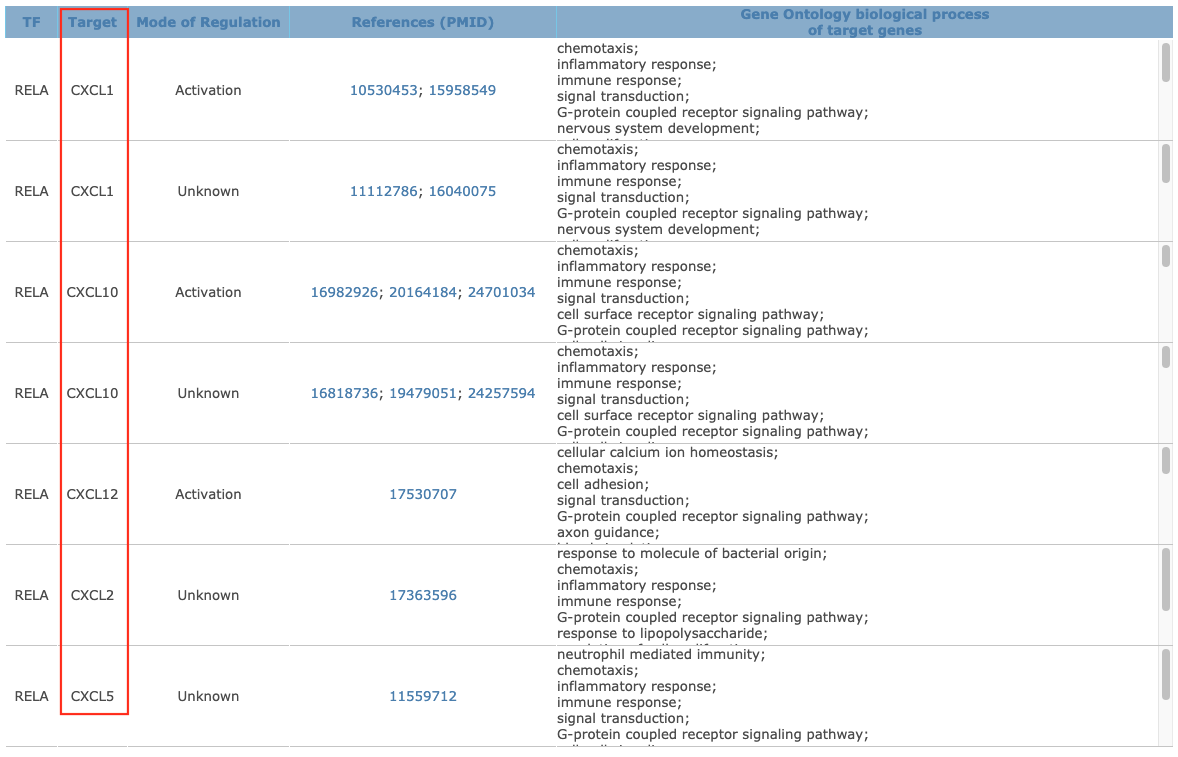
-
Edit the result and get the result of table2
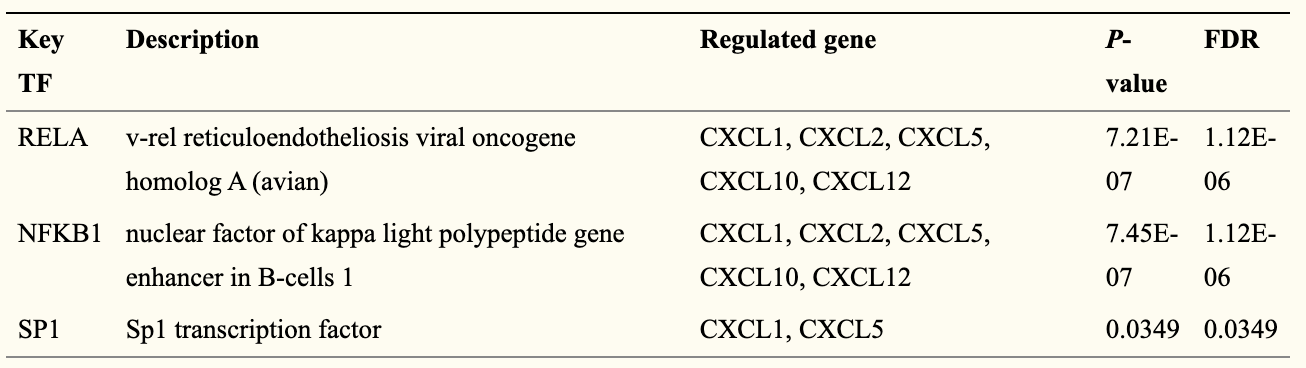
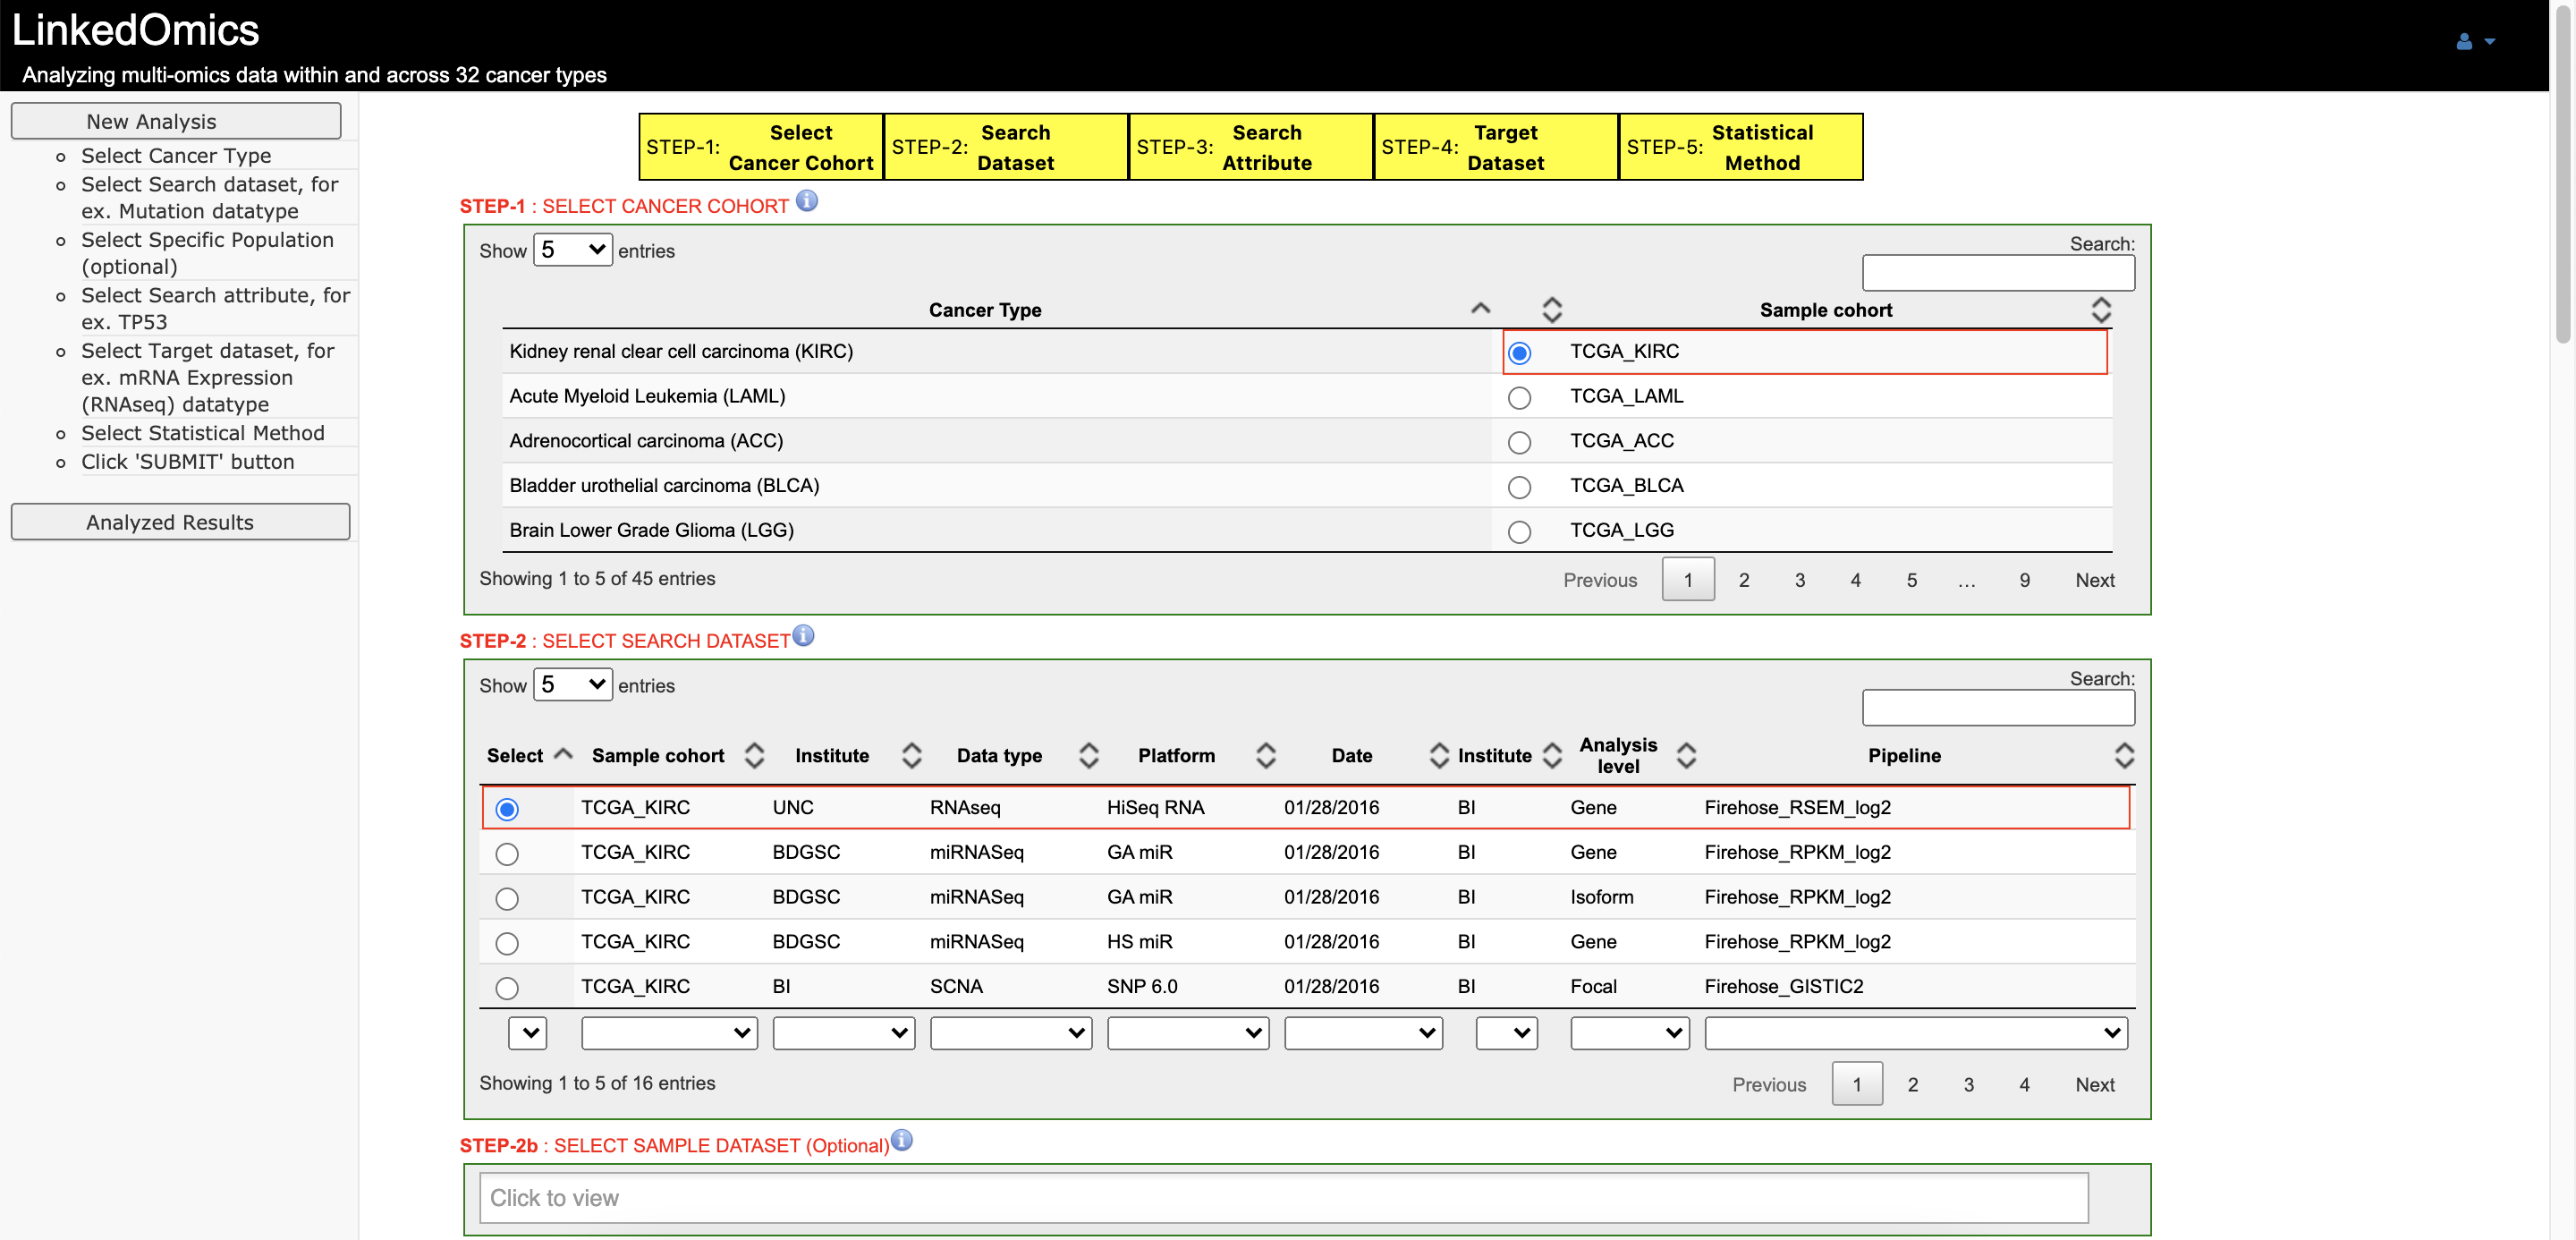
Table 3. The Kinase target networks of CXC chemokines in RCC (LinkedOmics)
-
Methods: LinkedOmics.
-
Open LinkedOmics
-
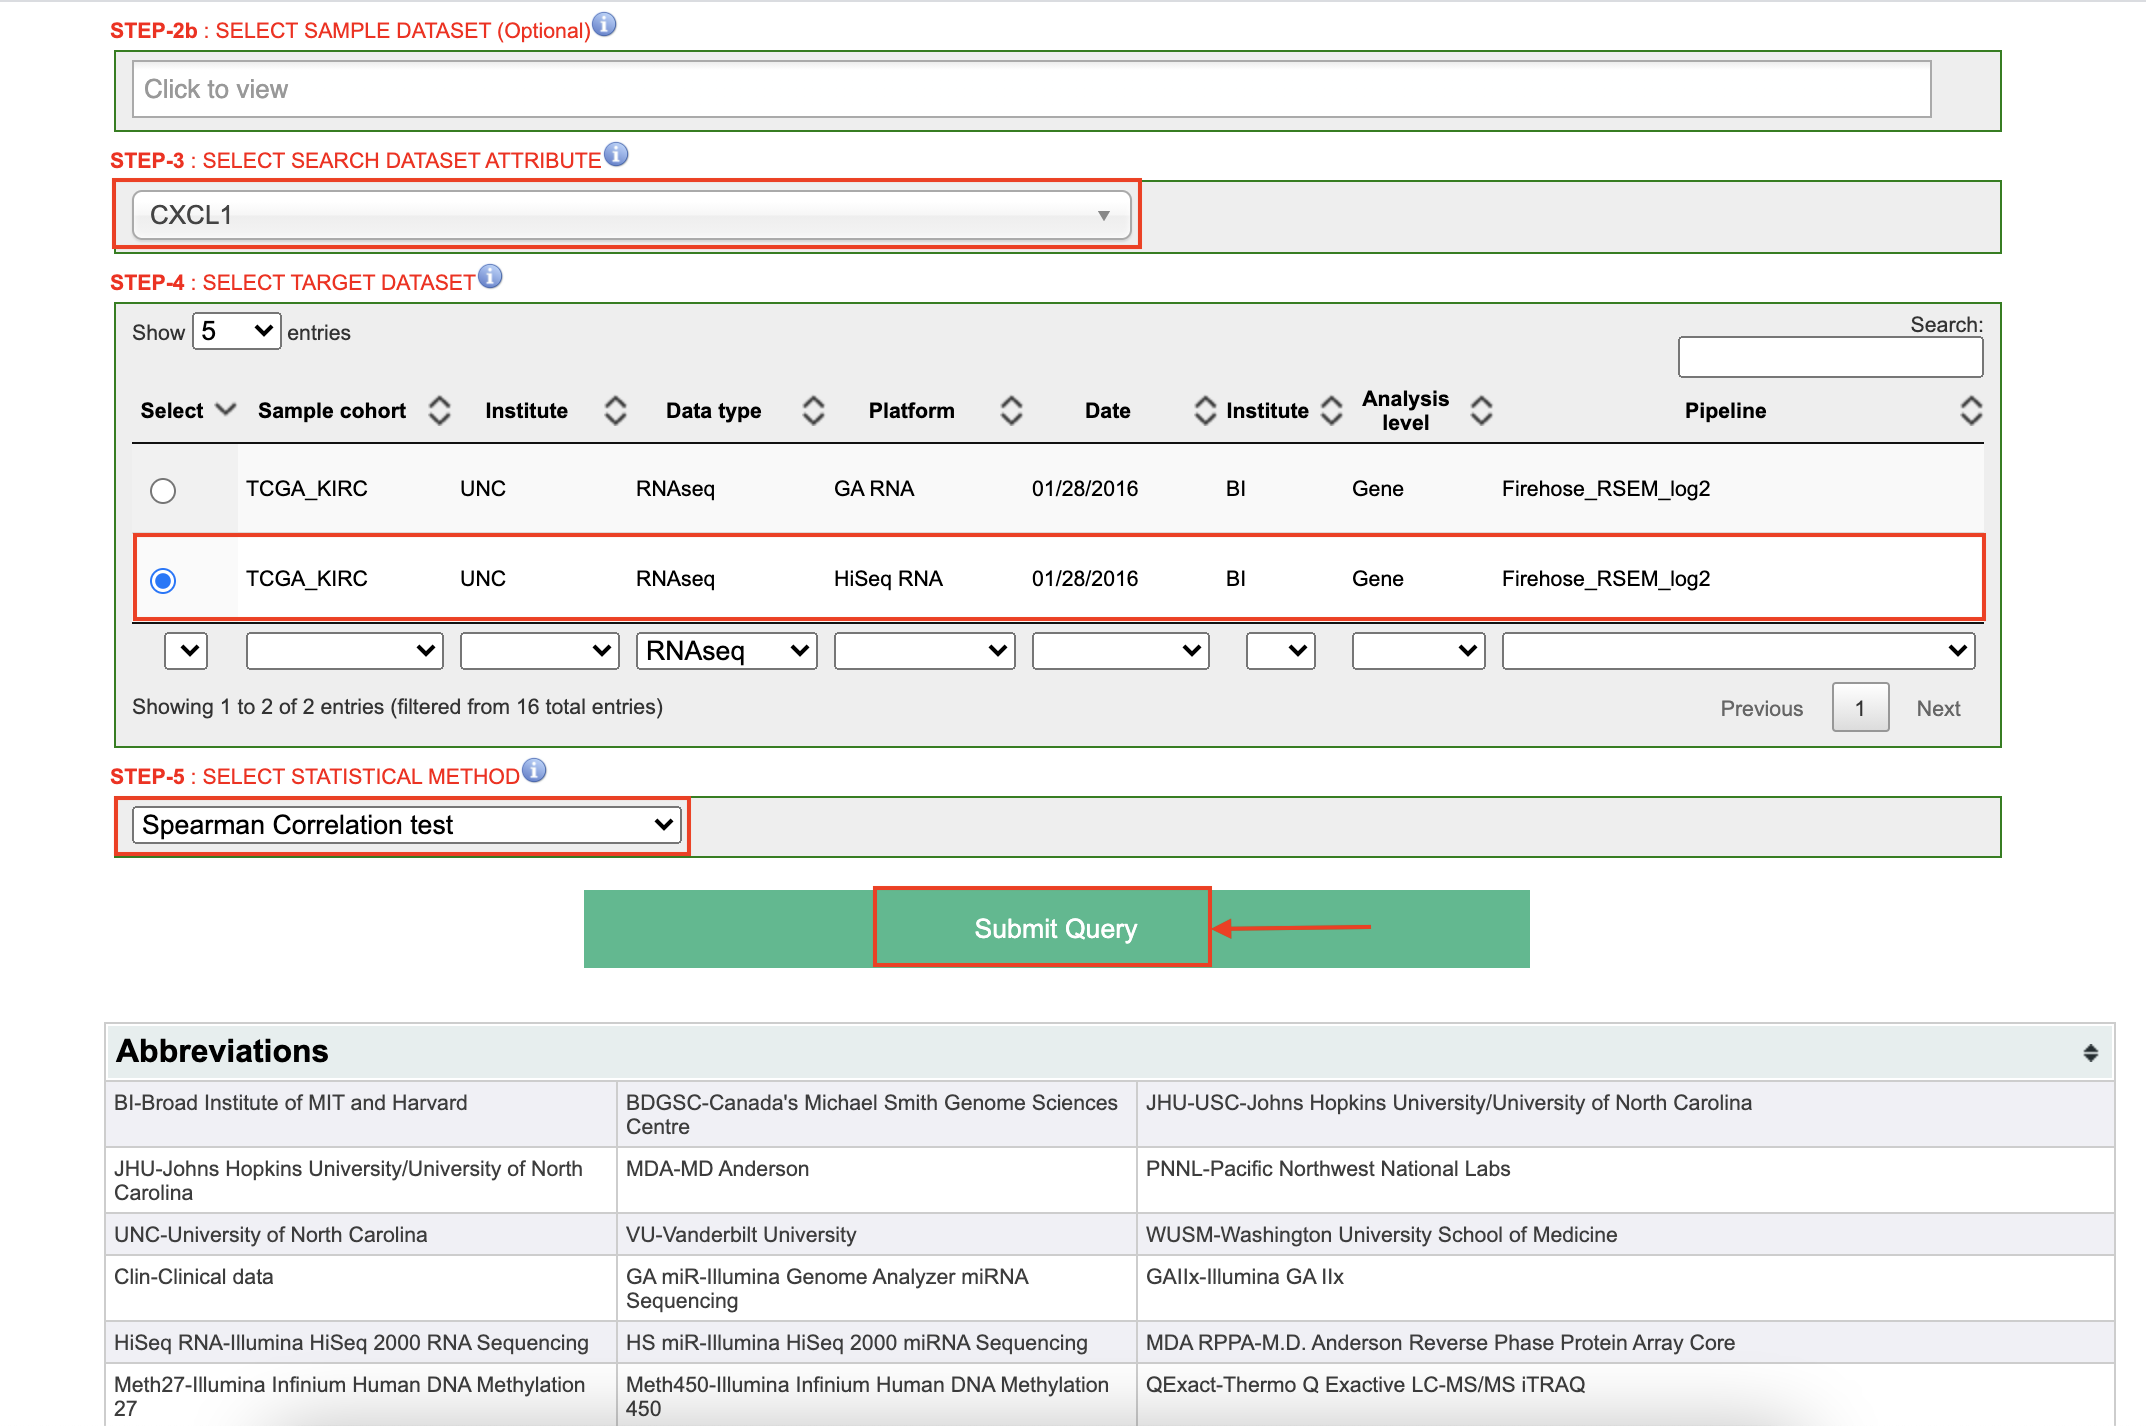
Set up the parameters for CXCL1 gene.
-
Click on the button
LinkInterpreter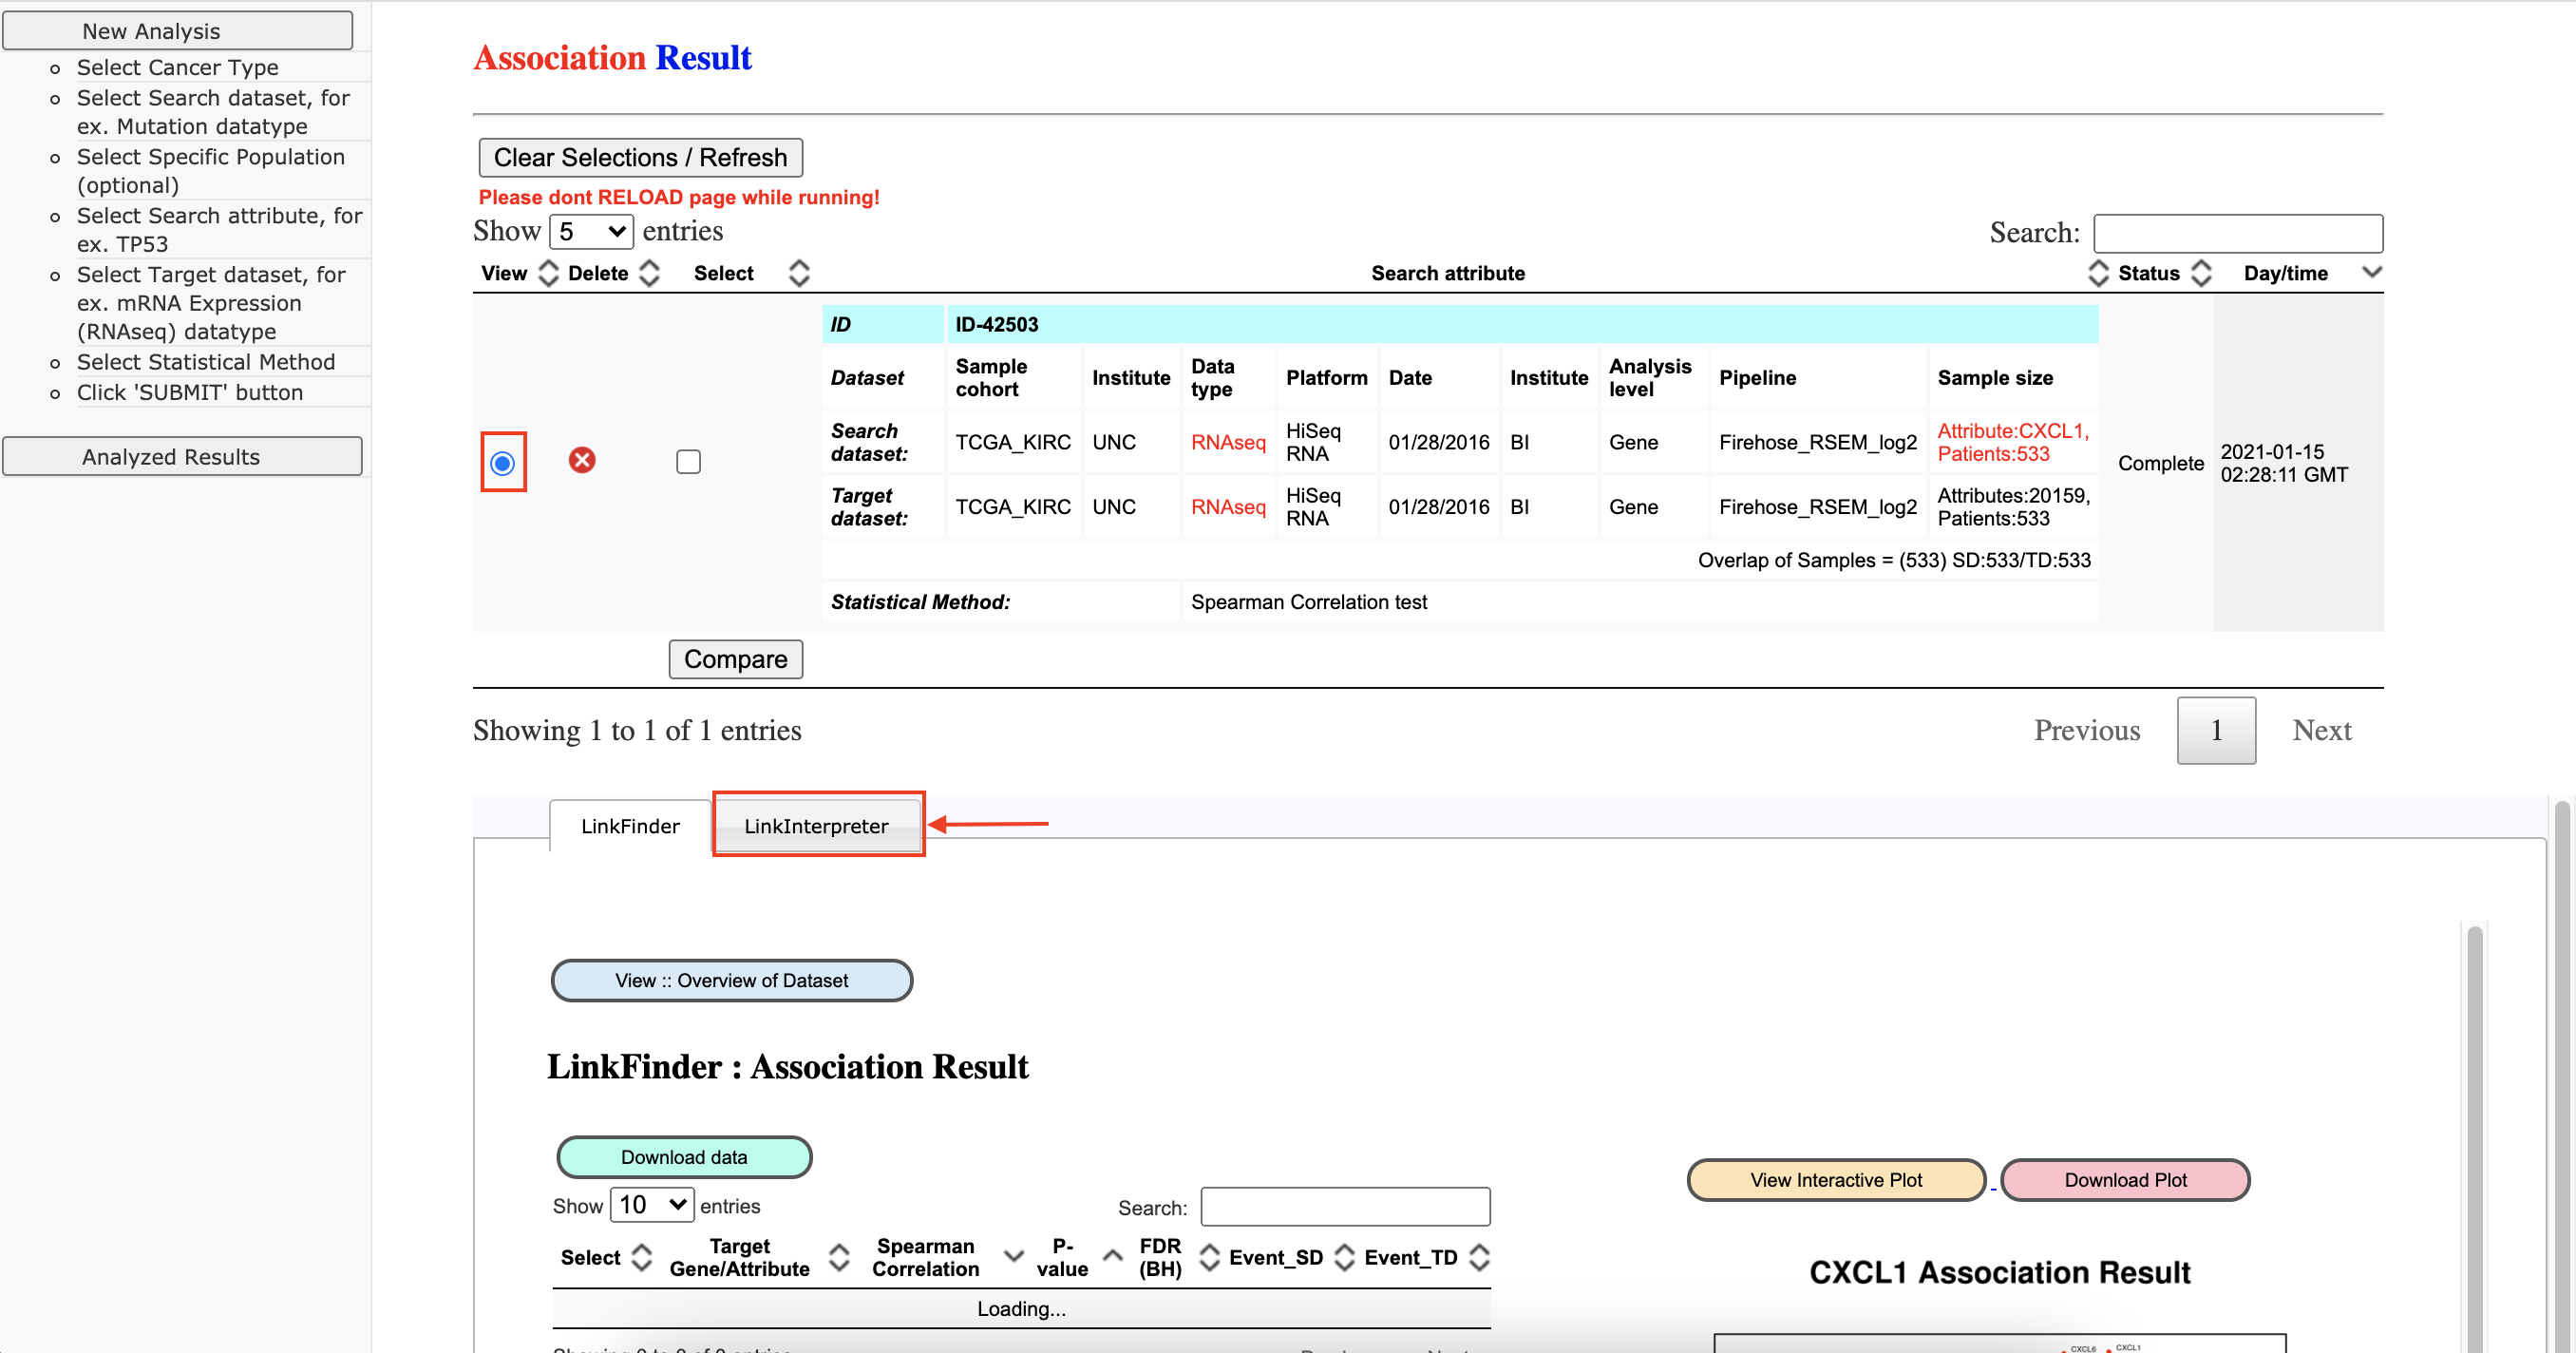
-
Set up the parameters to query
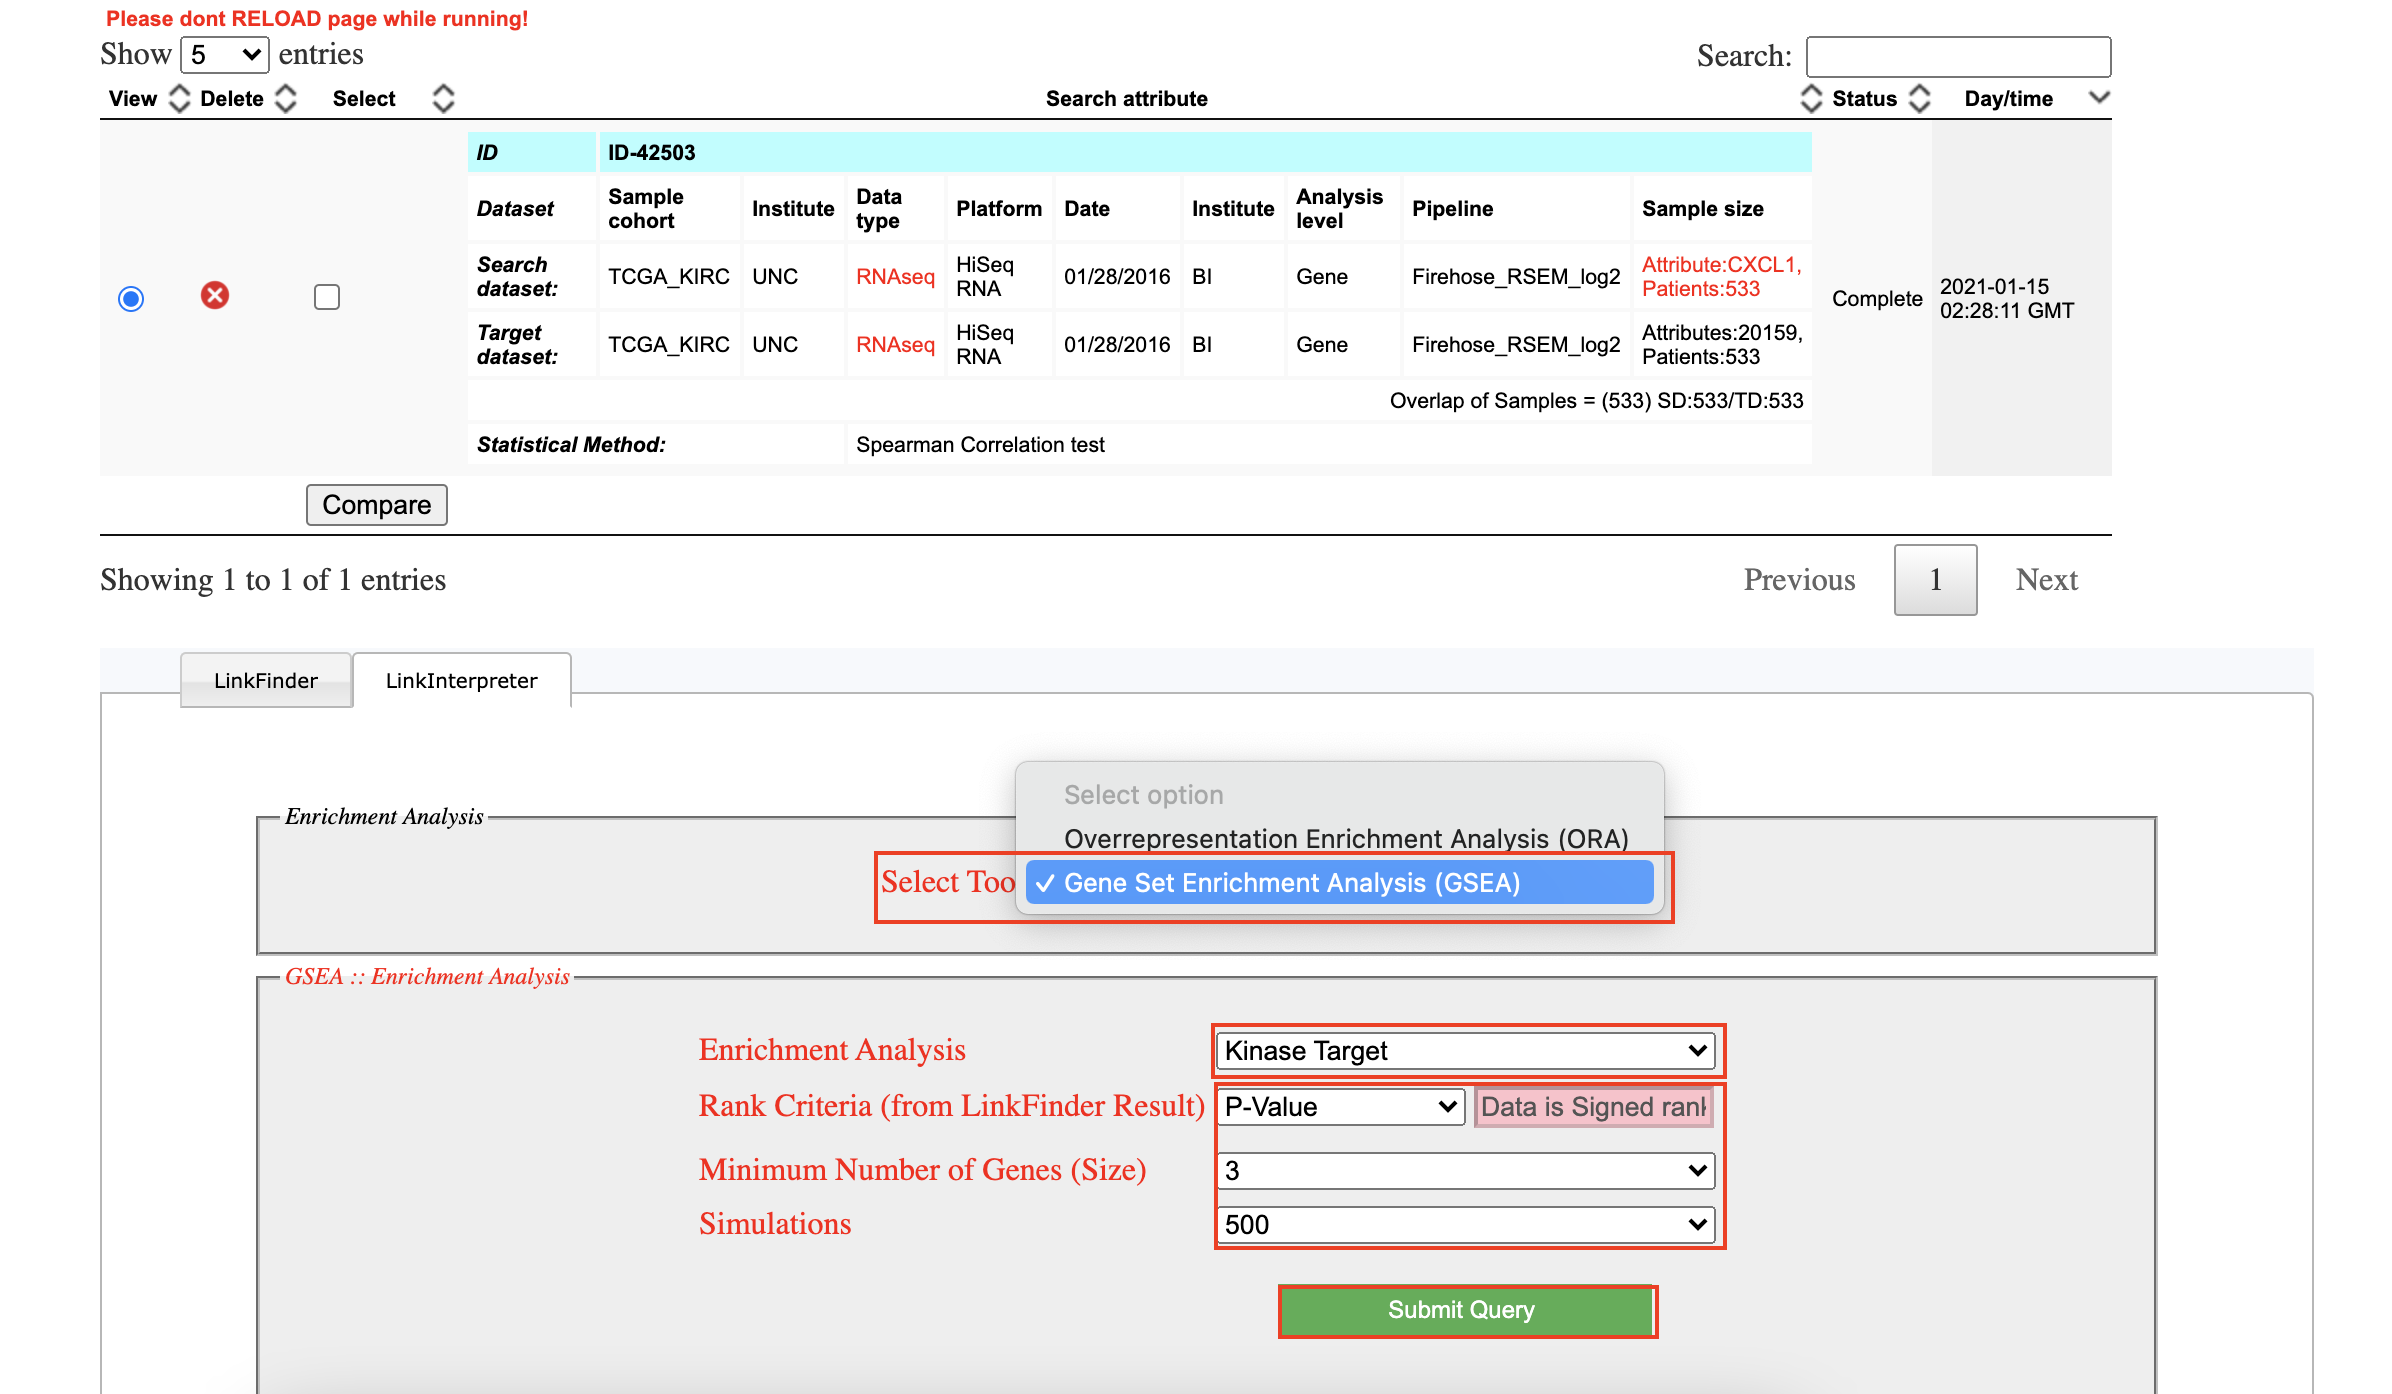
-
Download all results of CXCL1 gene.
-
Similarly, get other CXC chemokines following the above steps.
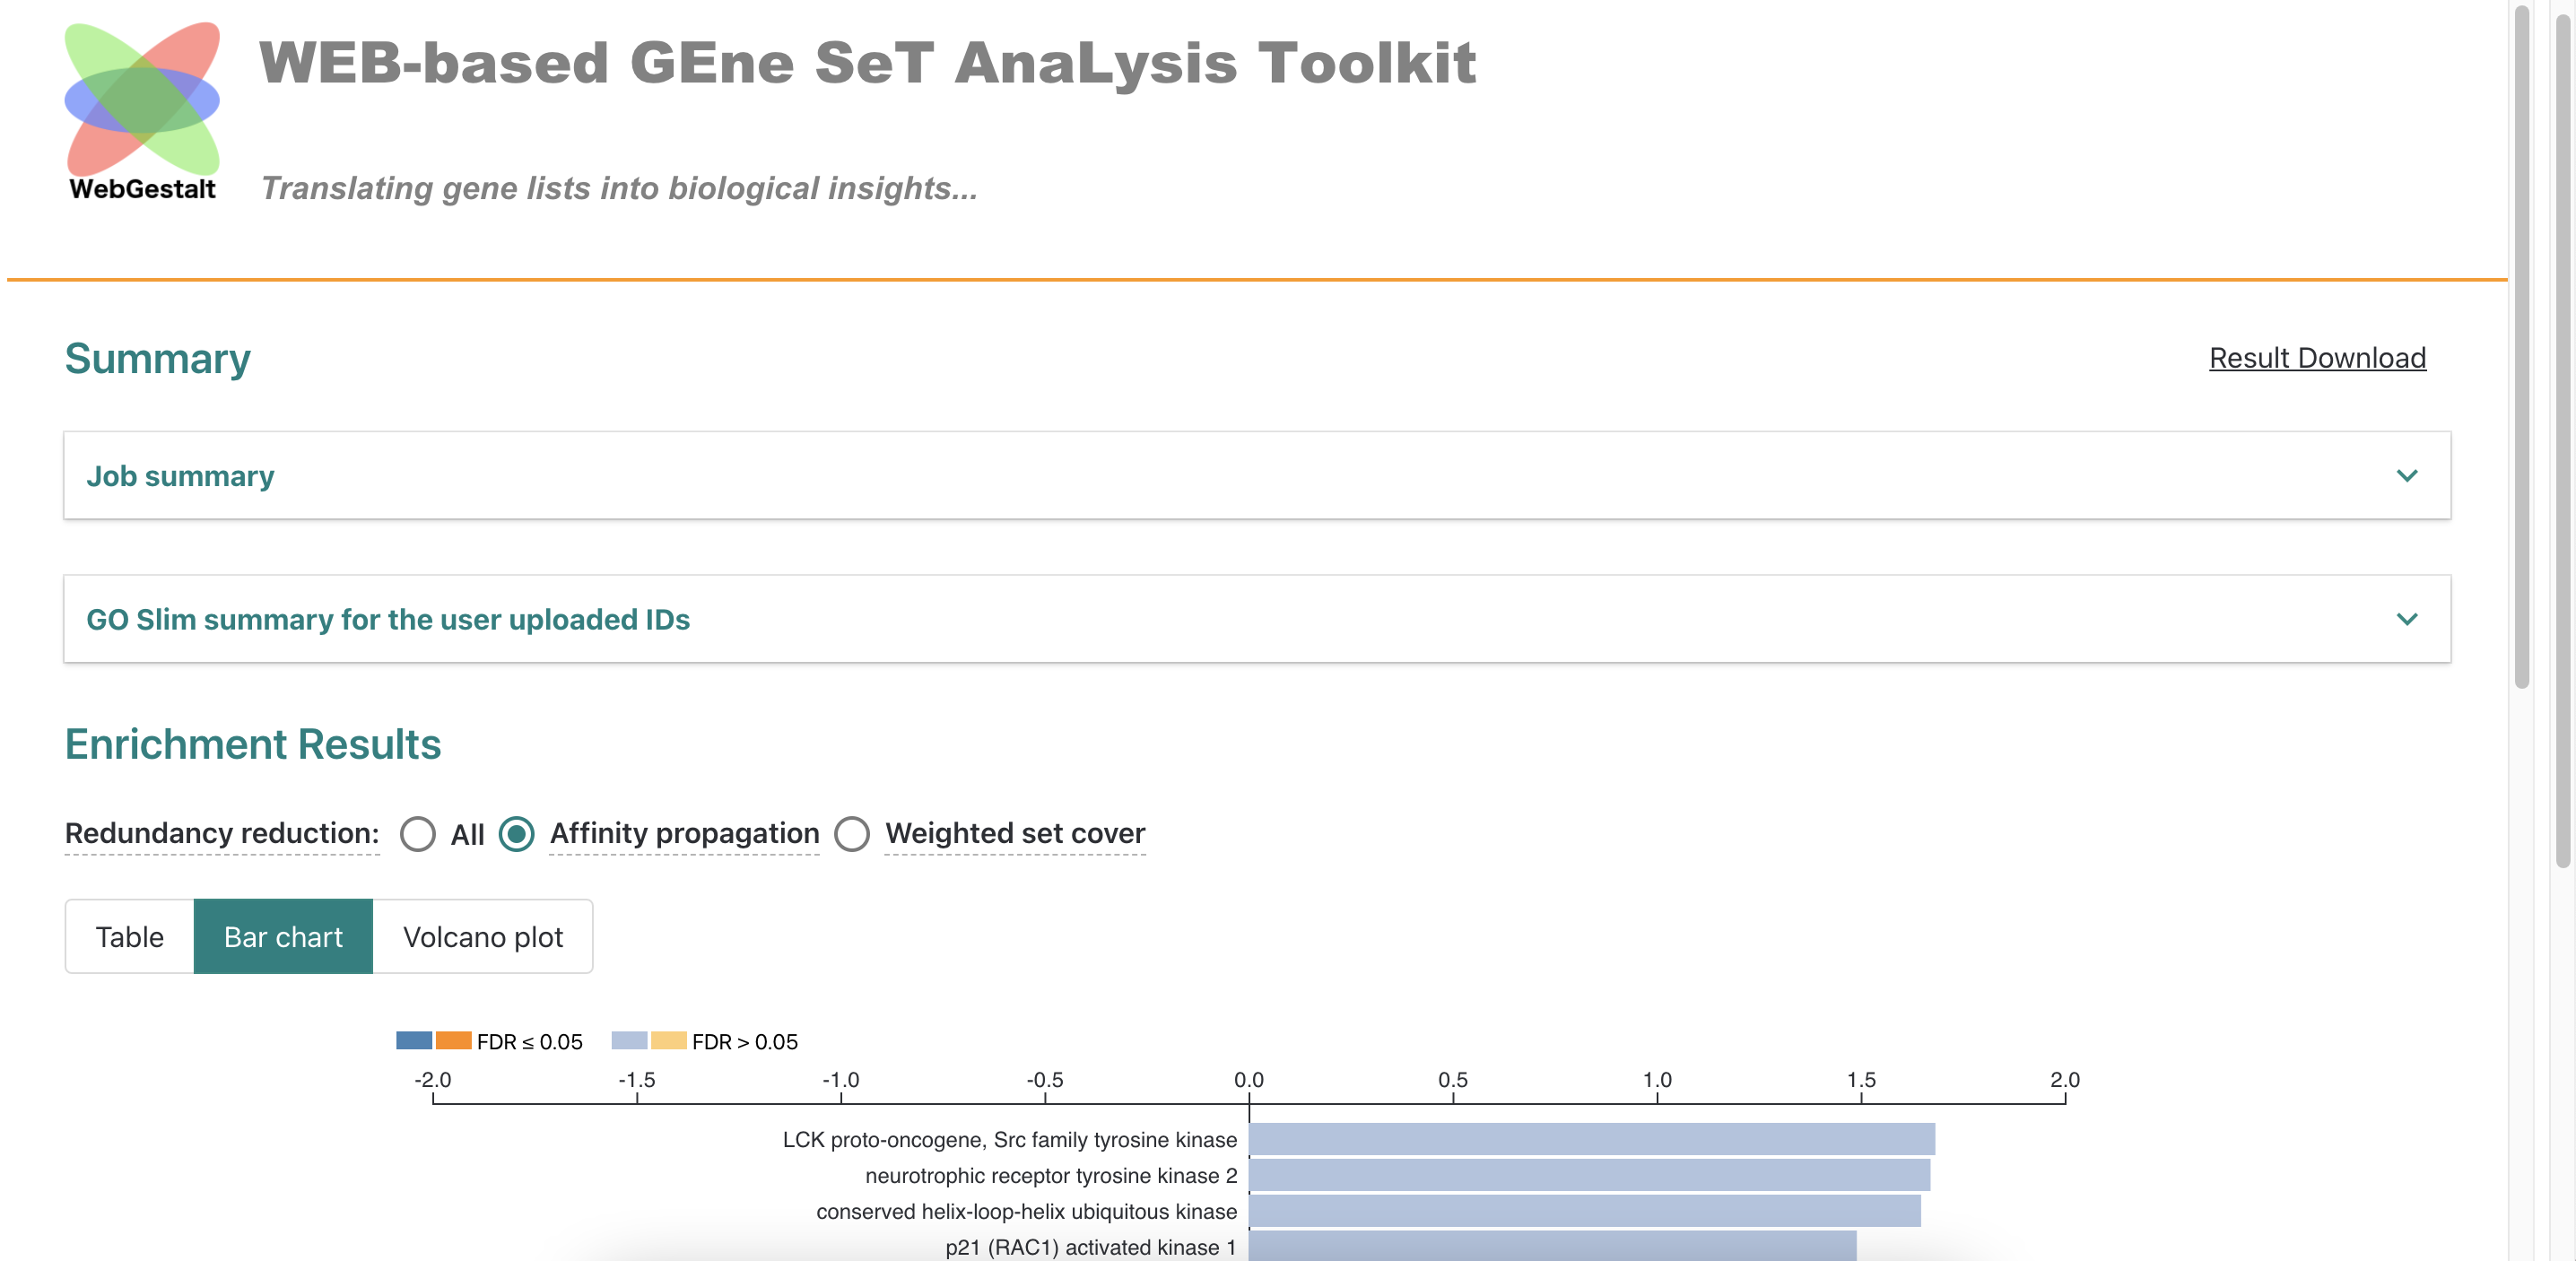
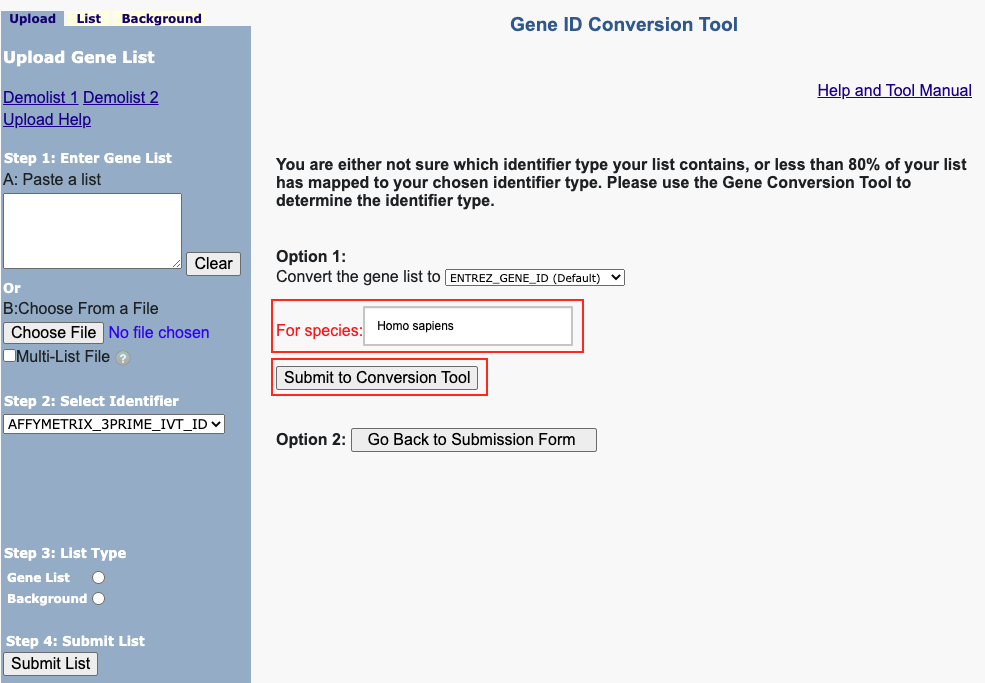
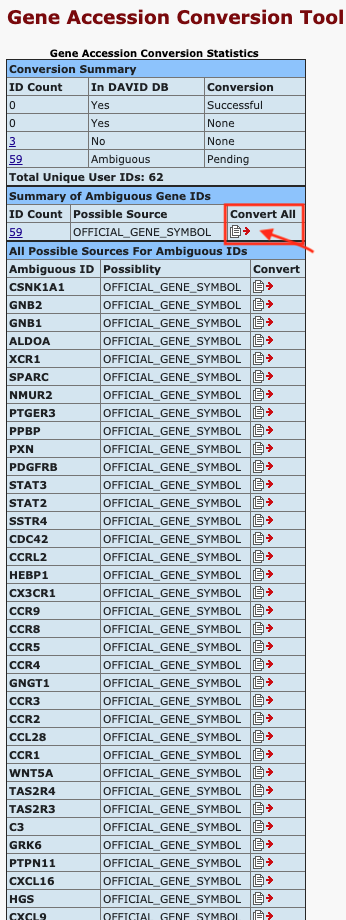
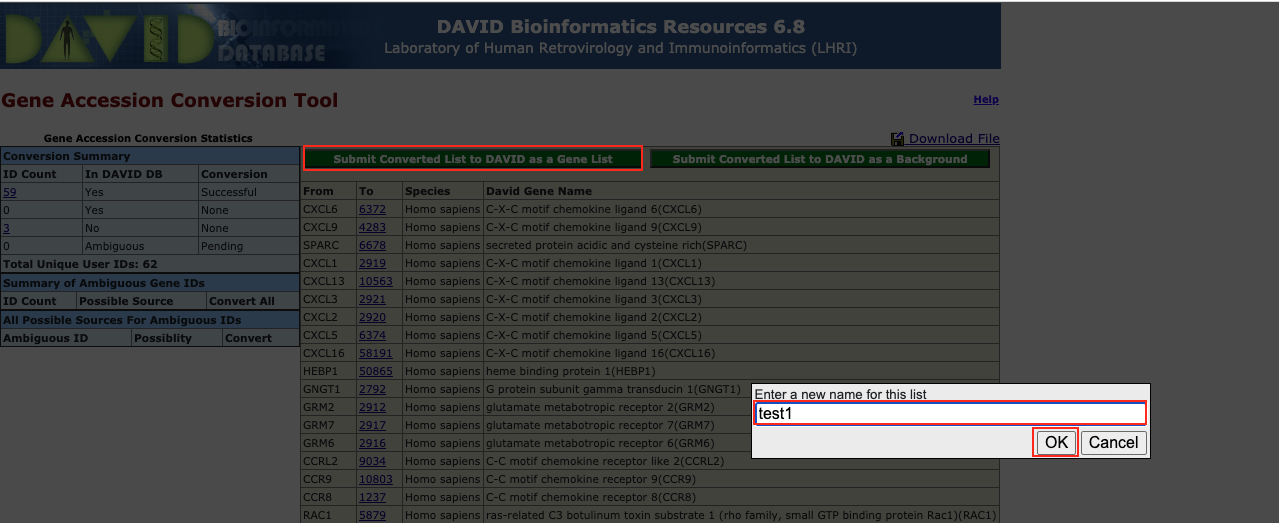
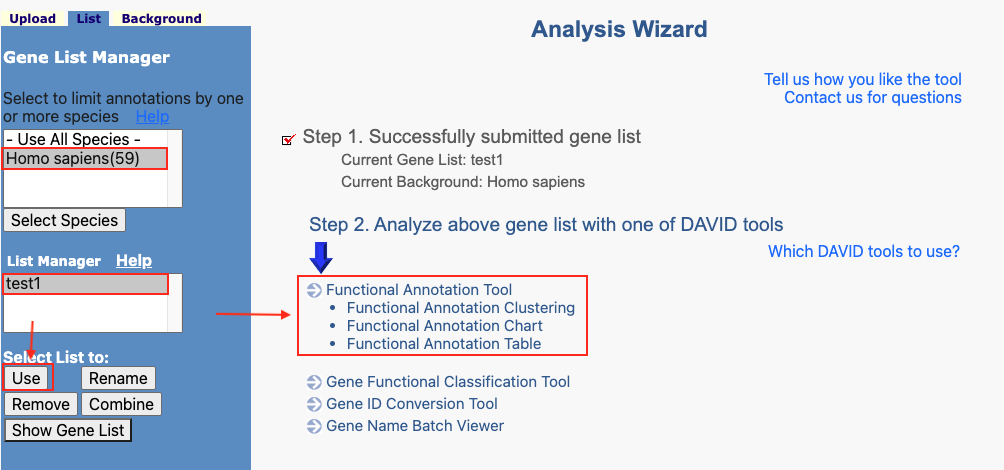
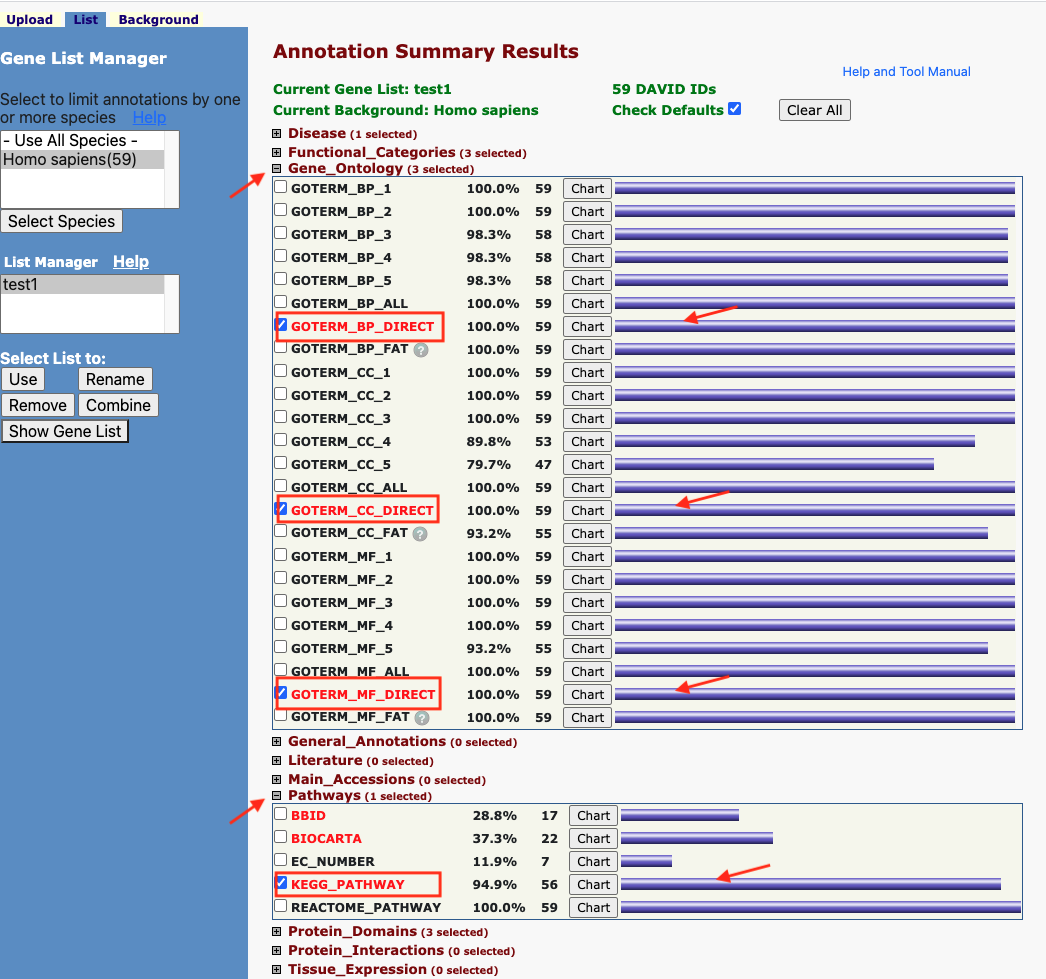
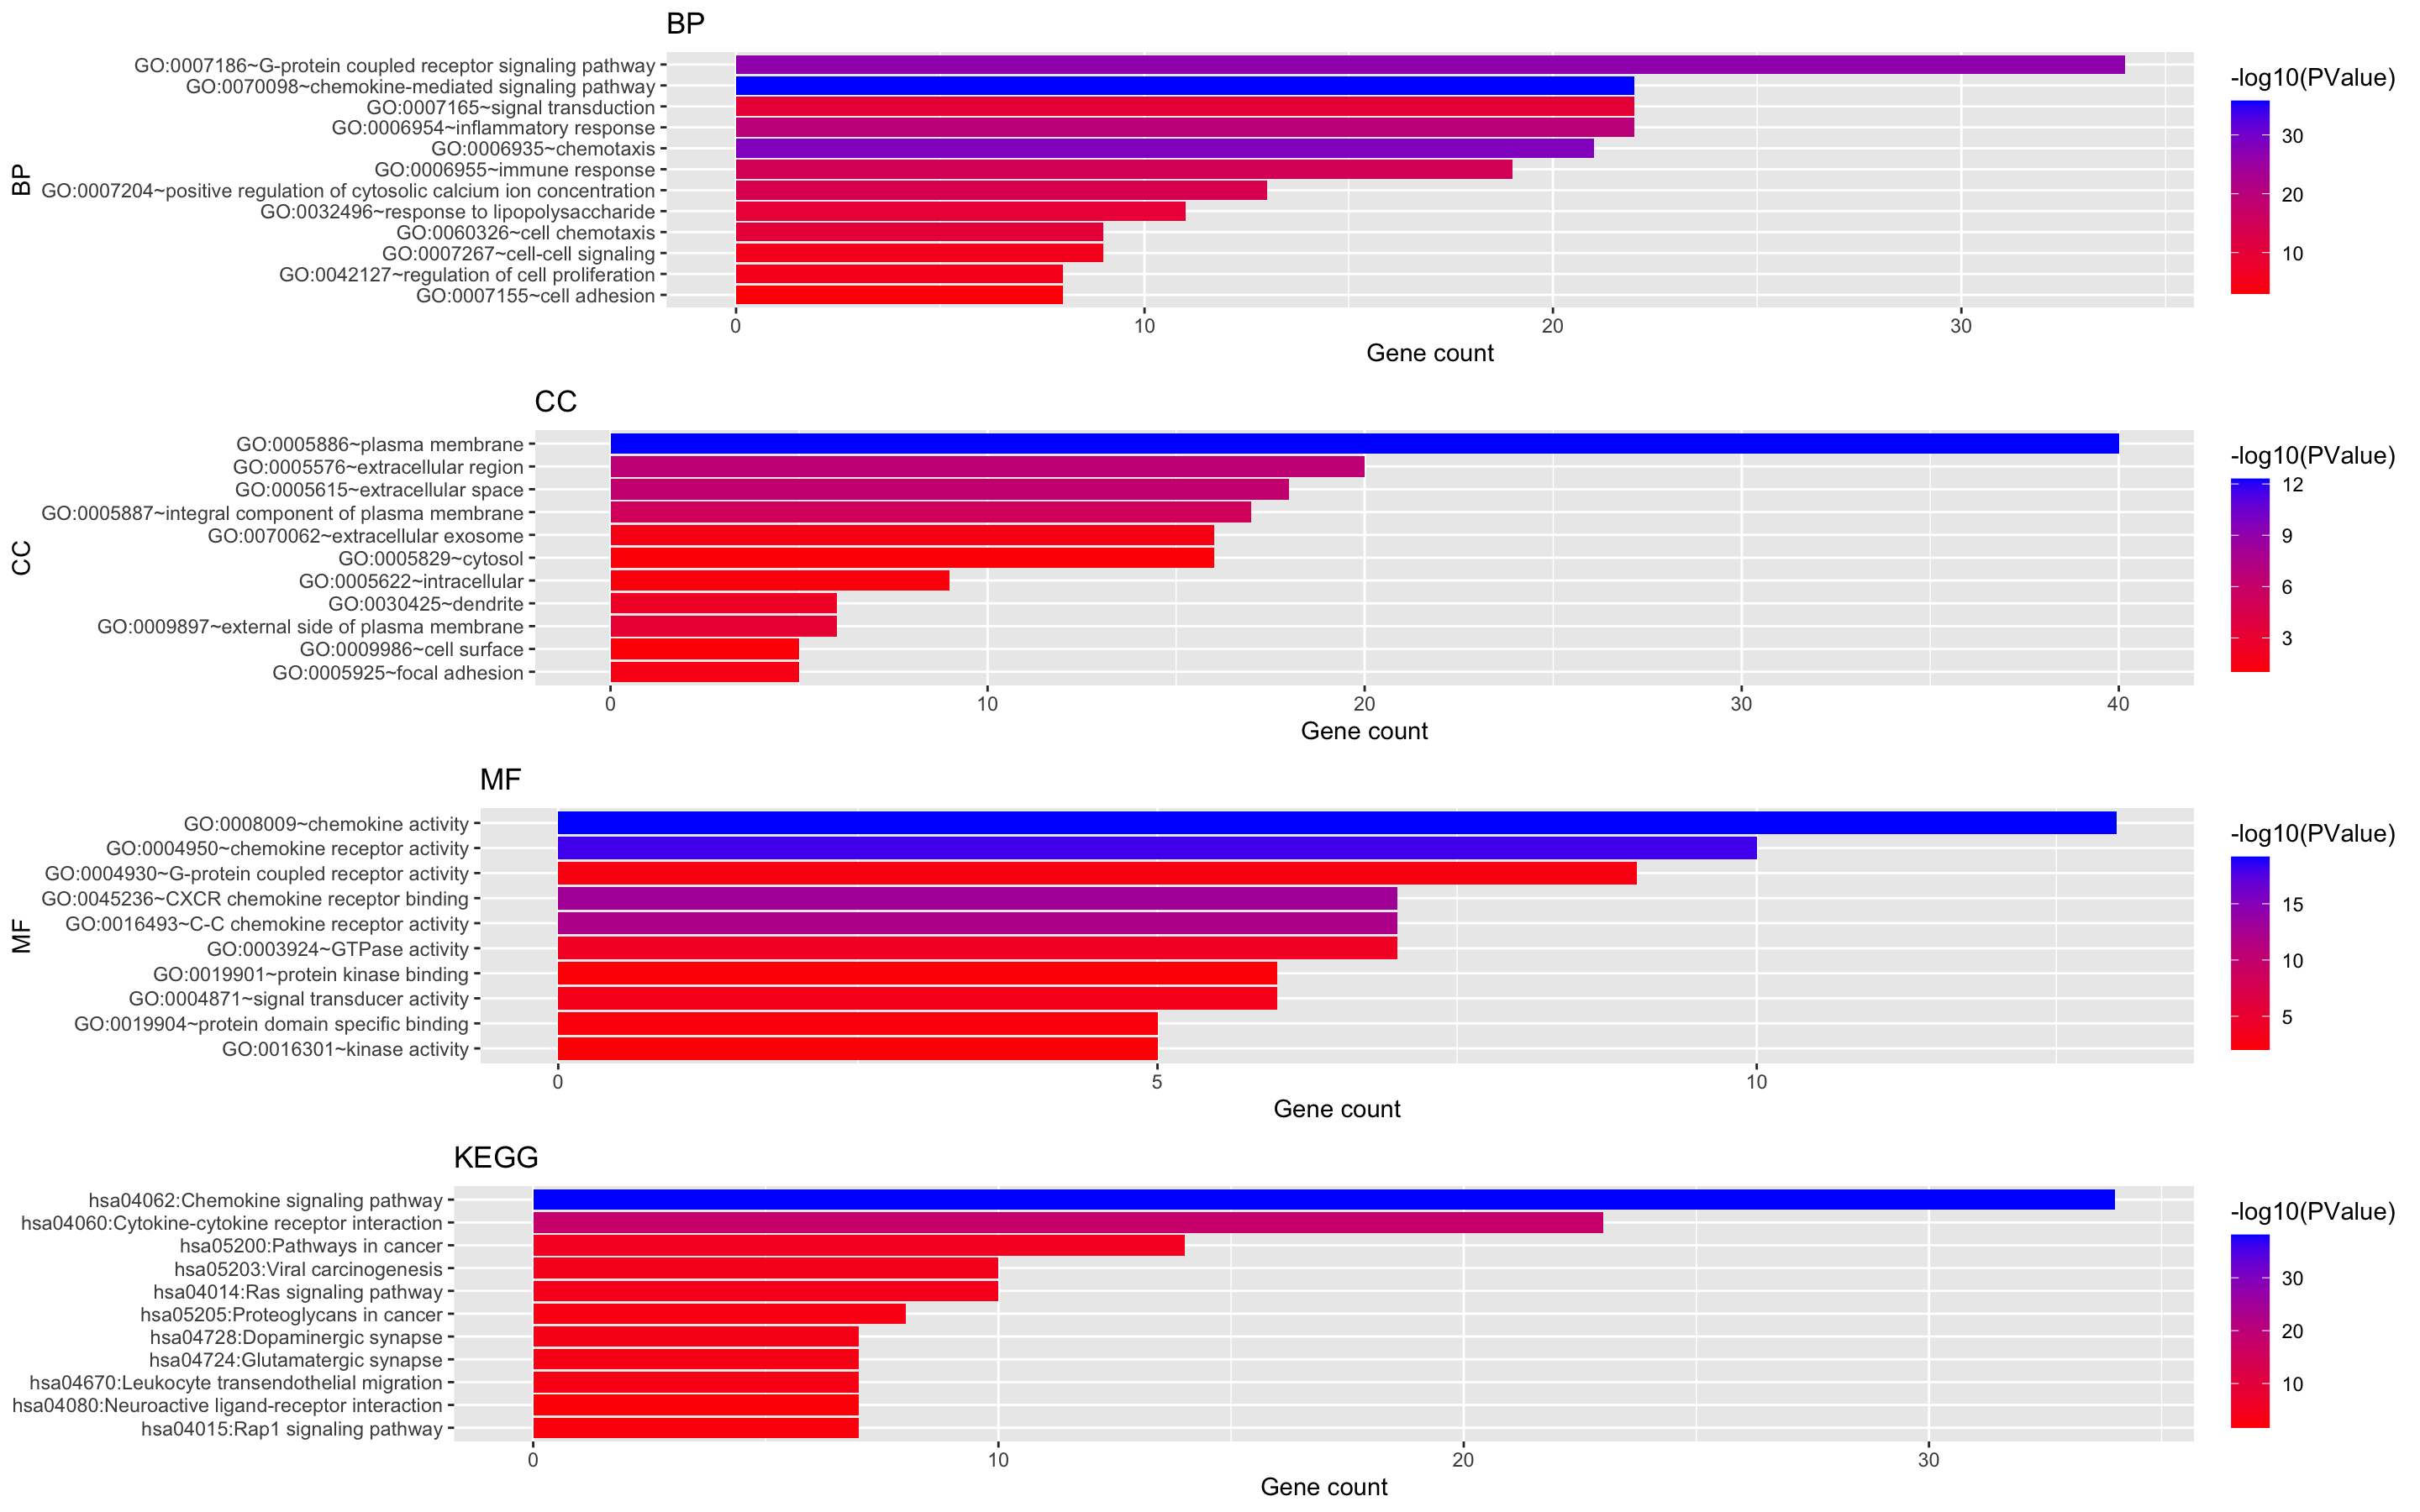
Figure 8. The enrichment analysis of different expressed CXC chemokines and 50 most frequently altered neighboring genes in RCC (David 6.8)
-
Methods: David 6.8.
-
Open DAVID
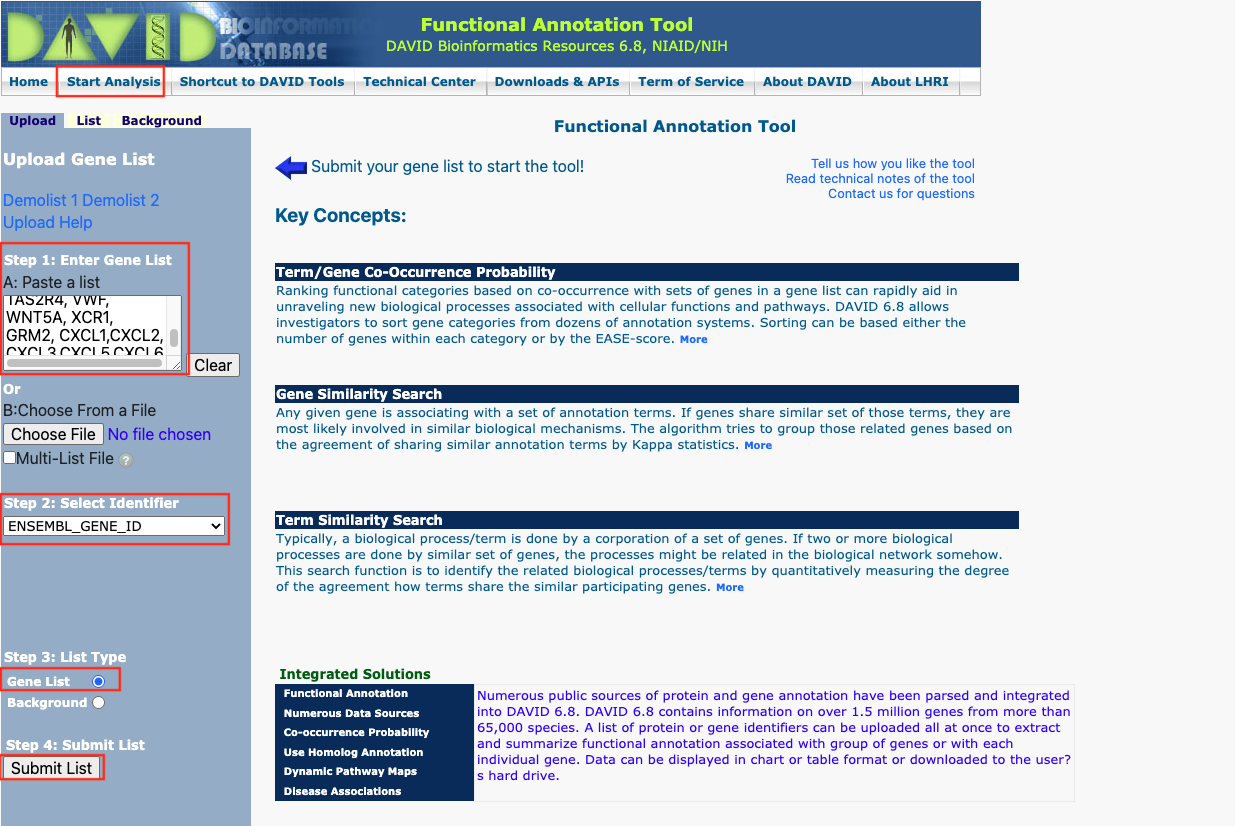
-
Follow the protocol step by step.
-
Generate the result of bar plot with R.Script
-
Alternate, generate the result of dot plot.
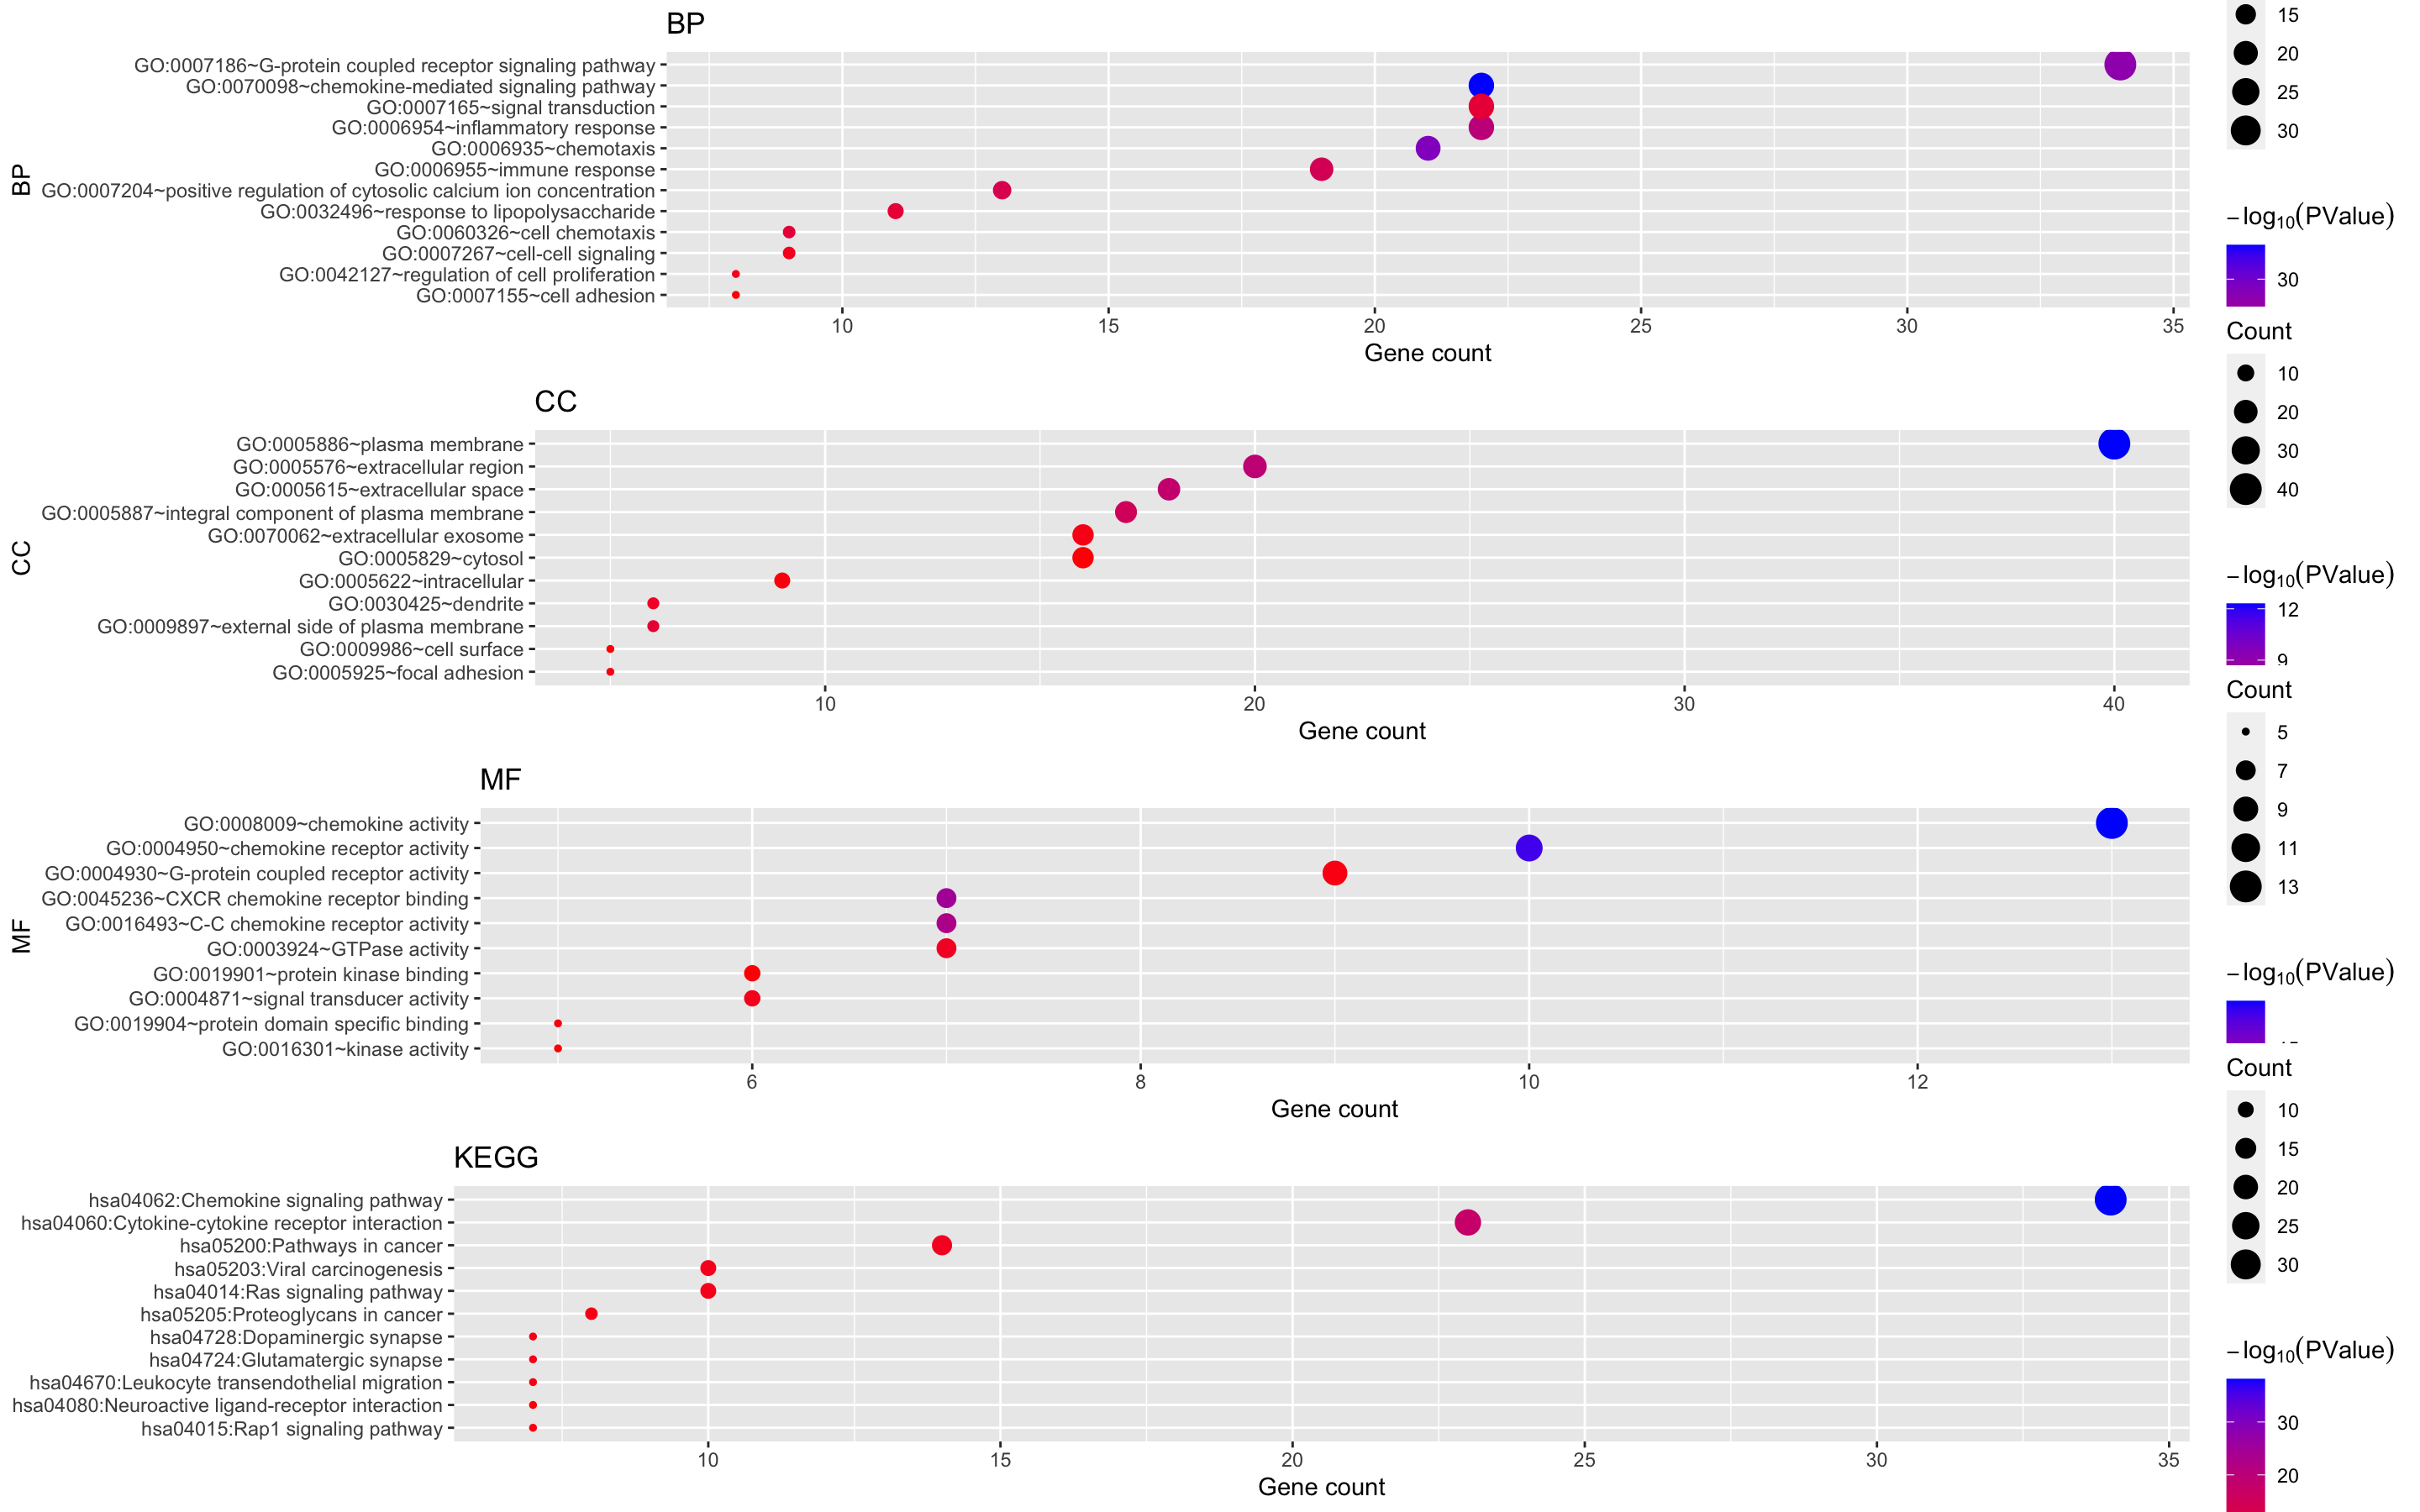
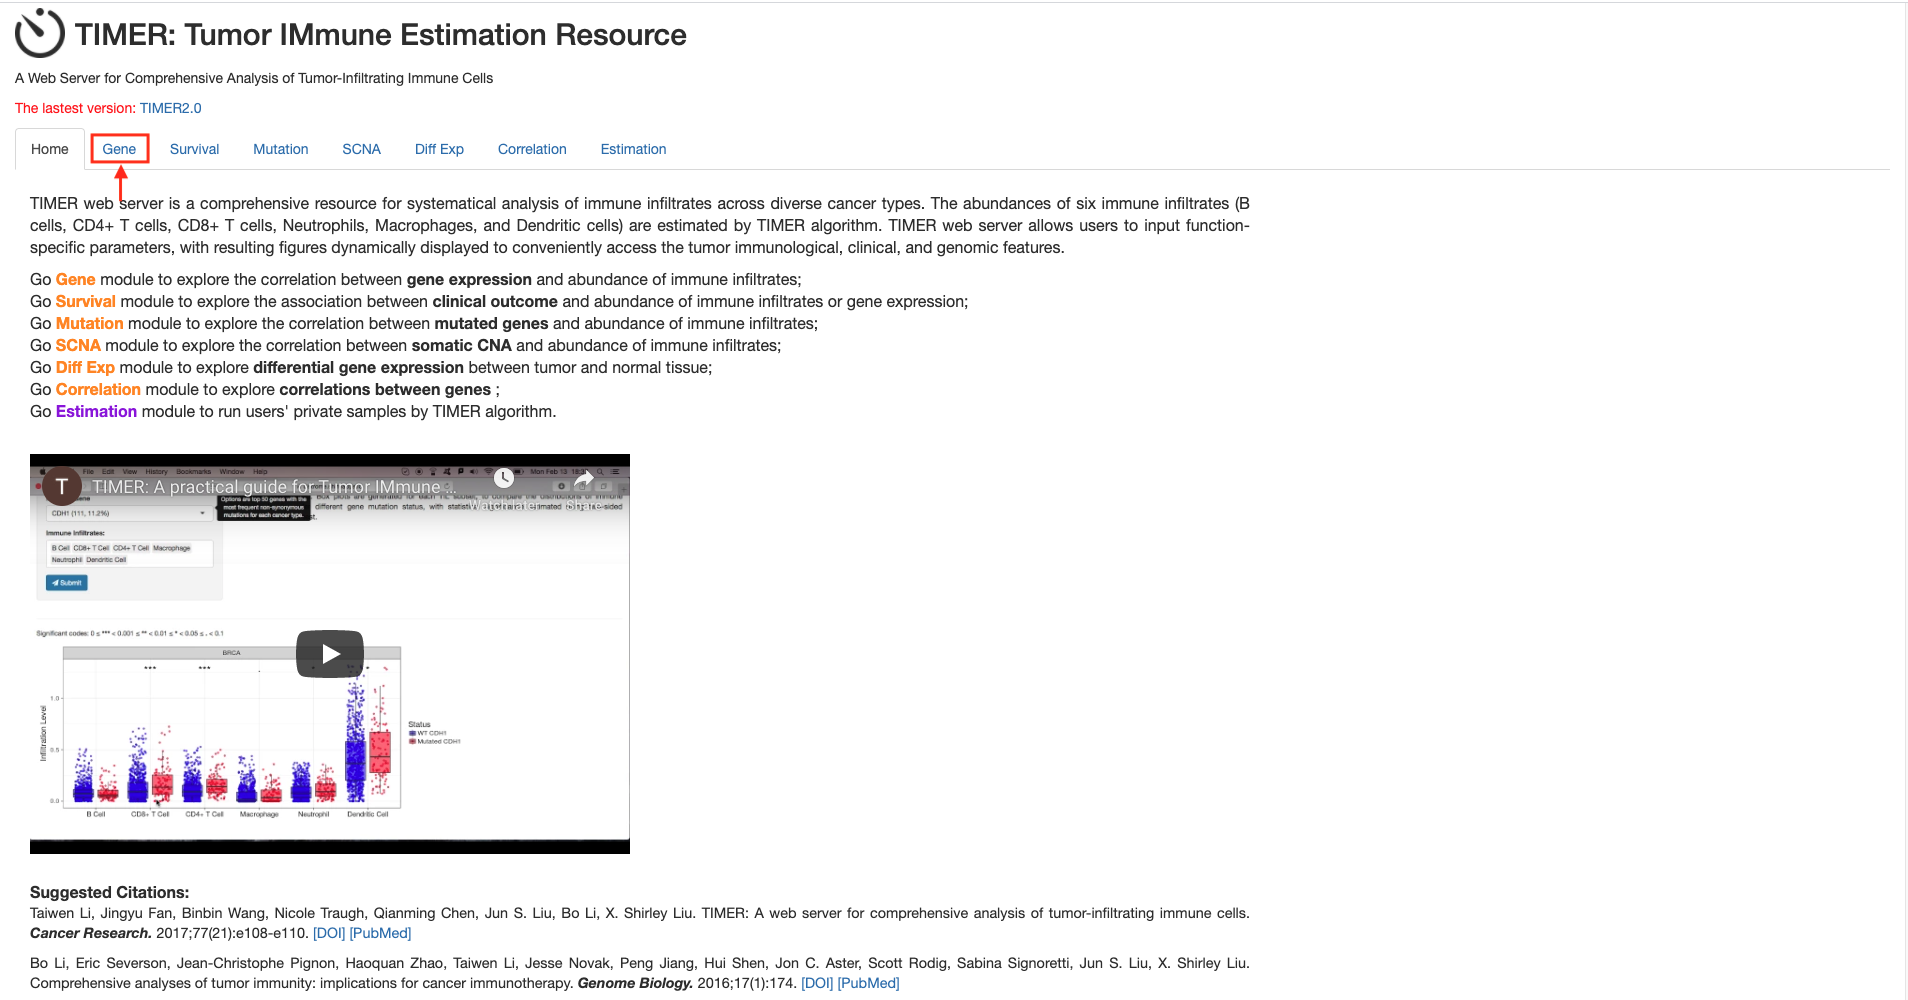
Figure 9. The correlation between different expressed CXC chemokines and immune cell infiltration (TIMER)
-
Methods: TIMER.
-
Open TIMER
-
Click on
gene -
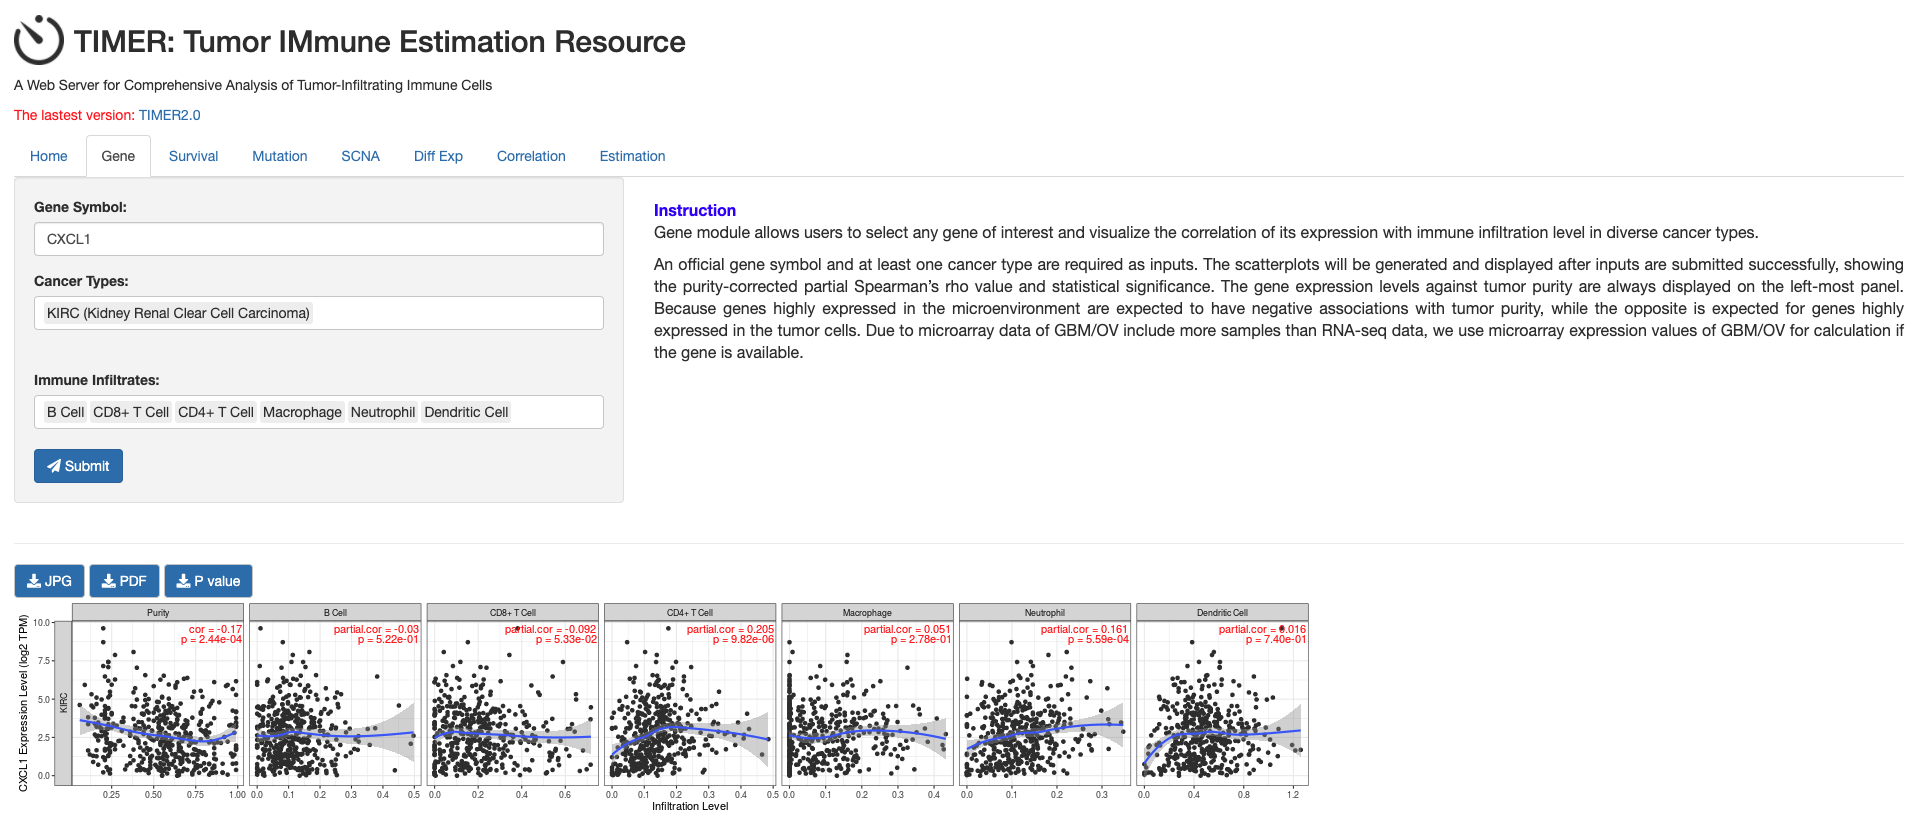
Set up the parameters for CXCL1 gene and click the button
Submit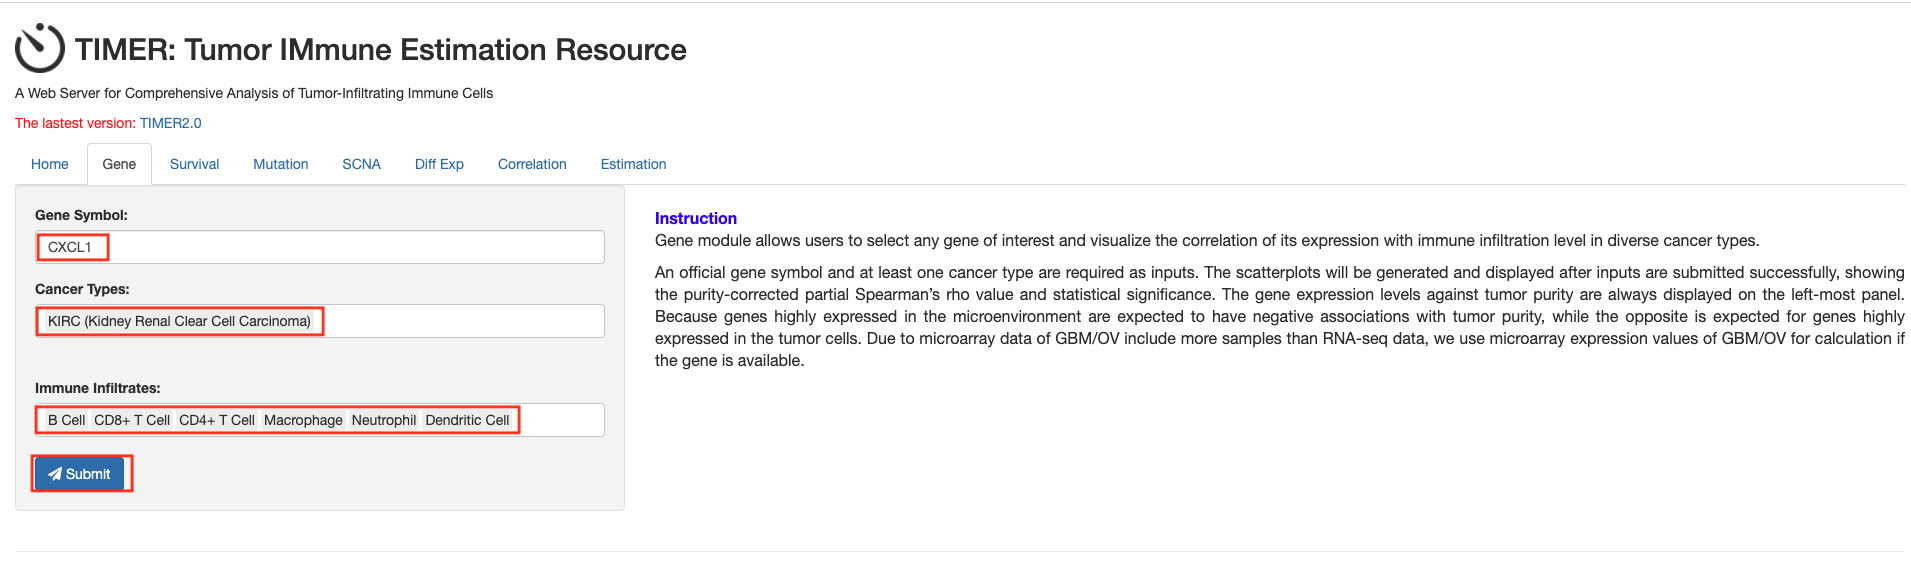
-
get the result of CXCL1 gene
-
Merge all results of CXC chemokines together with Google Slides
Table 4. The cox proportional hazard model of CXC chemokines and six tumor-infiltrating immune cells in RCC (TIMER)
-
Methods: TIMER.
-
Setup the cox proportional hazard of CXC chemokines
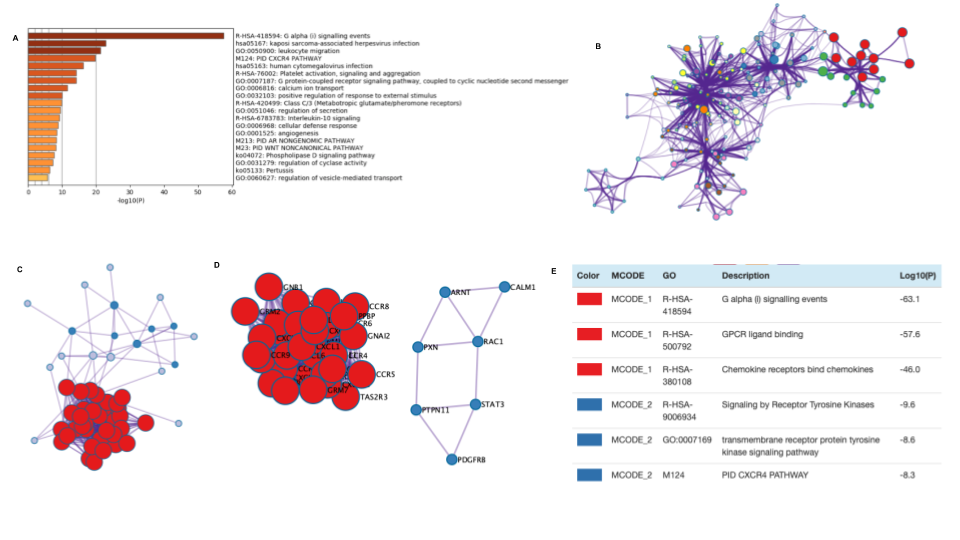
Supplementary Figure 1. The enrichment analysis of different expressed CXC chemokines and 50 most frequently altered neighboring genes in RCC (Metascape)
-
Methods: Metascape.
-
Open Metascape
-
Click on the button
Express Analysis -
Click on the button
Analysis Report Page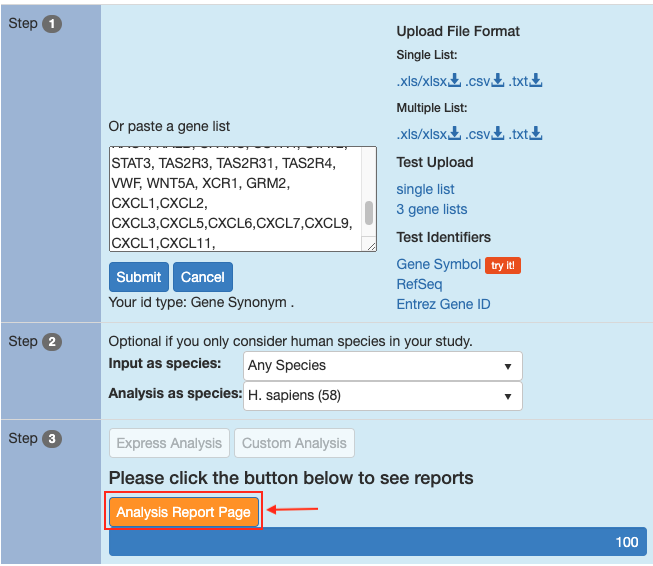
-
Generate the results of Supplementary Figure 1
In Summary
In this study, the authors conducted an in-depth and comprehensive bioinformatics analysis of the expression of CXC chemokines in Renal cell carcinoma and evaluated their potential as therapeutic targets and prognostic biomarkers based on several large public databases.
The present study is a straightforward and comprehensive bioinformatics method, which could be implied to different genes and diseases.