OncoLnc Web Tool: Interactively exploring survival correlations, and for downloading clinical data coupled to expression data for mRNAs, miRNAs, or lncRNAs from TCGA.
In Brief
-
Offical website and Publication Link.
-
Data Wrangling and Re-analysis with R Package.
-
Summary
OncoLnc Usage
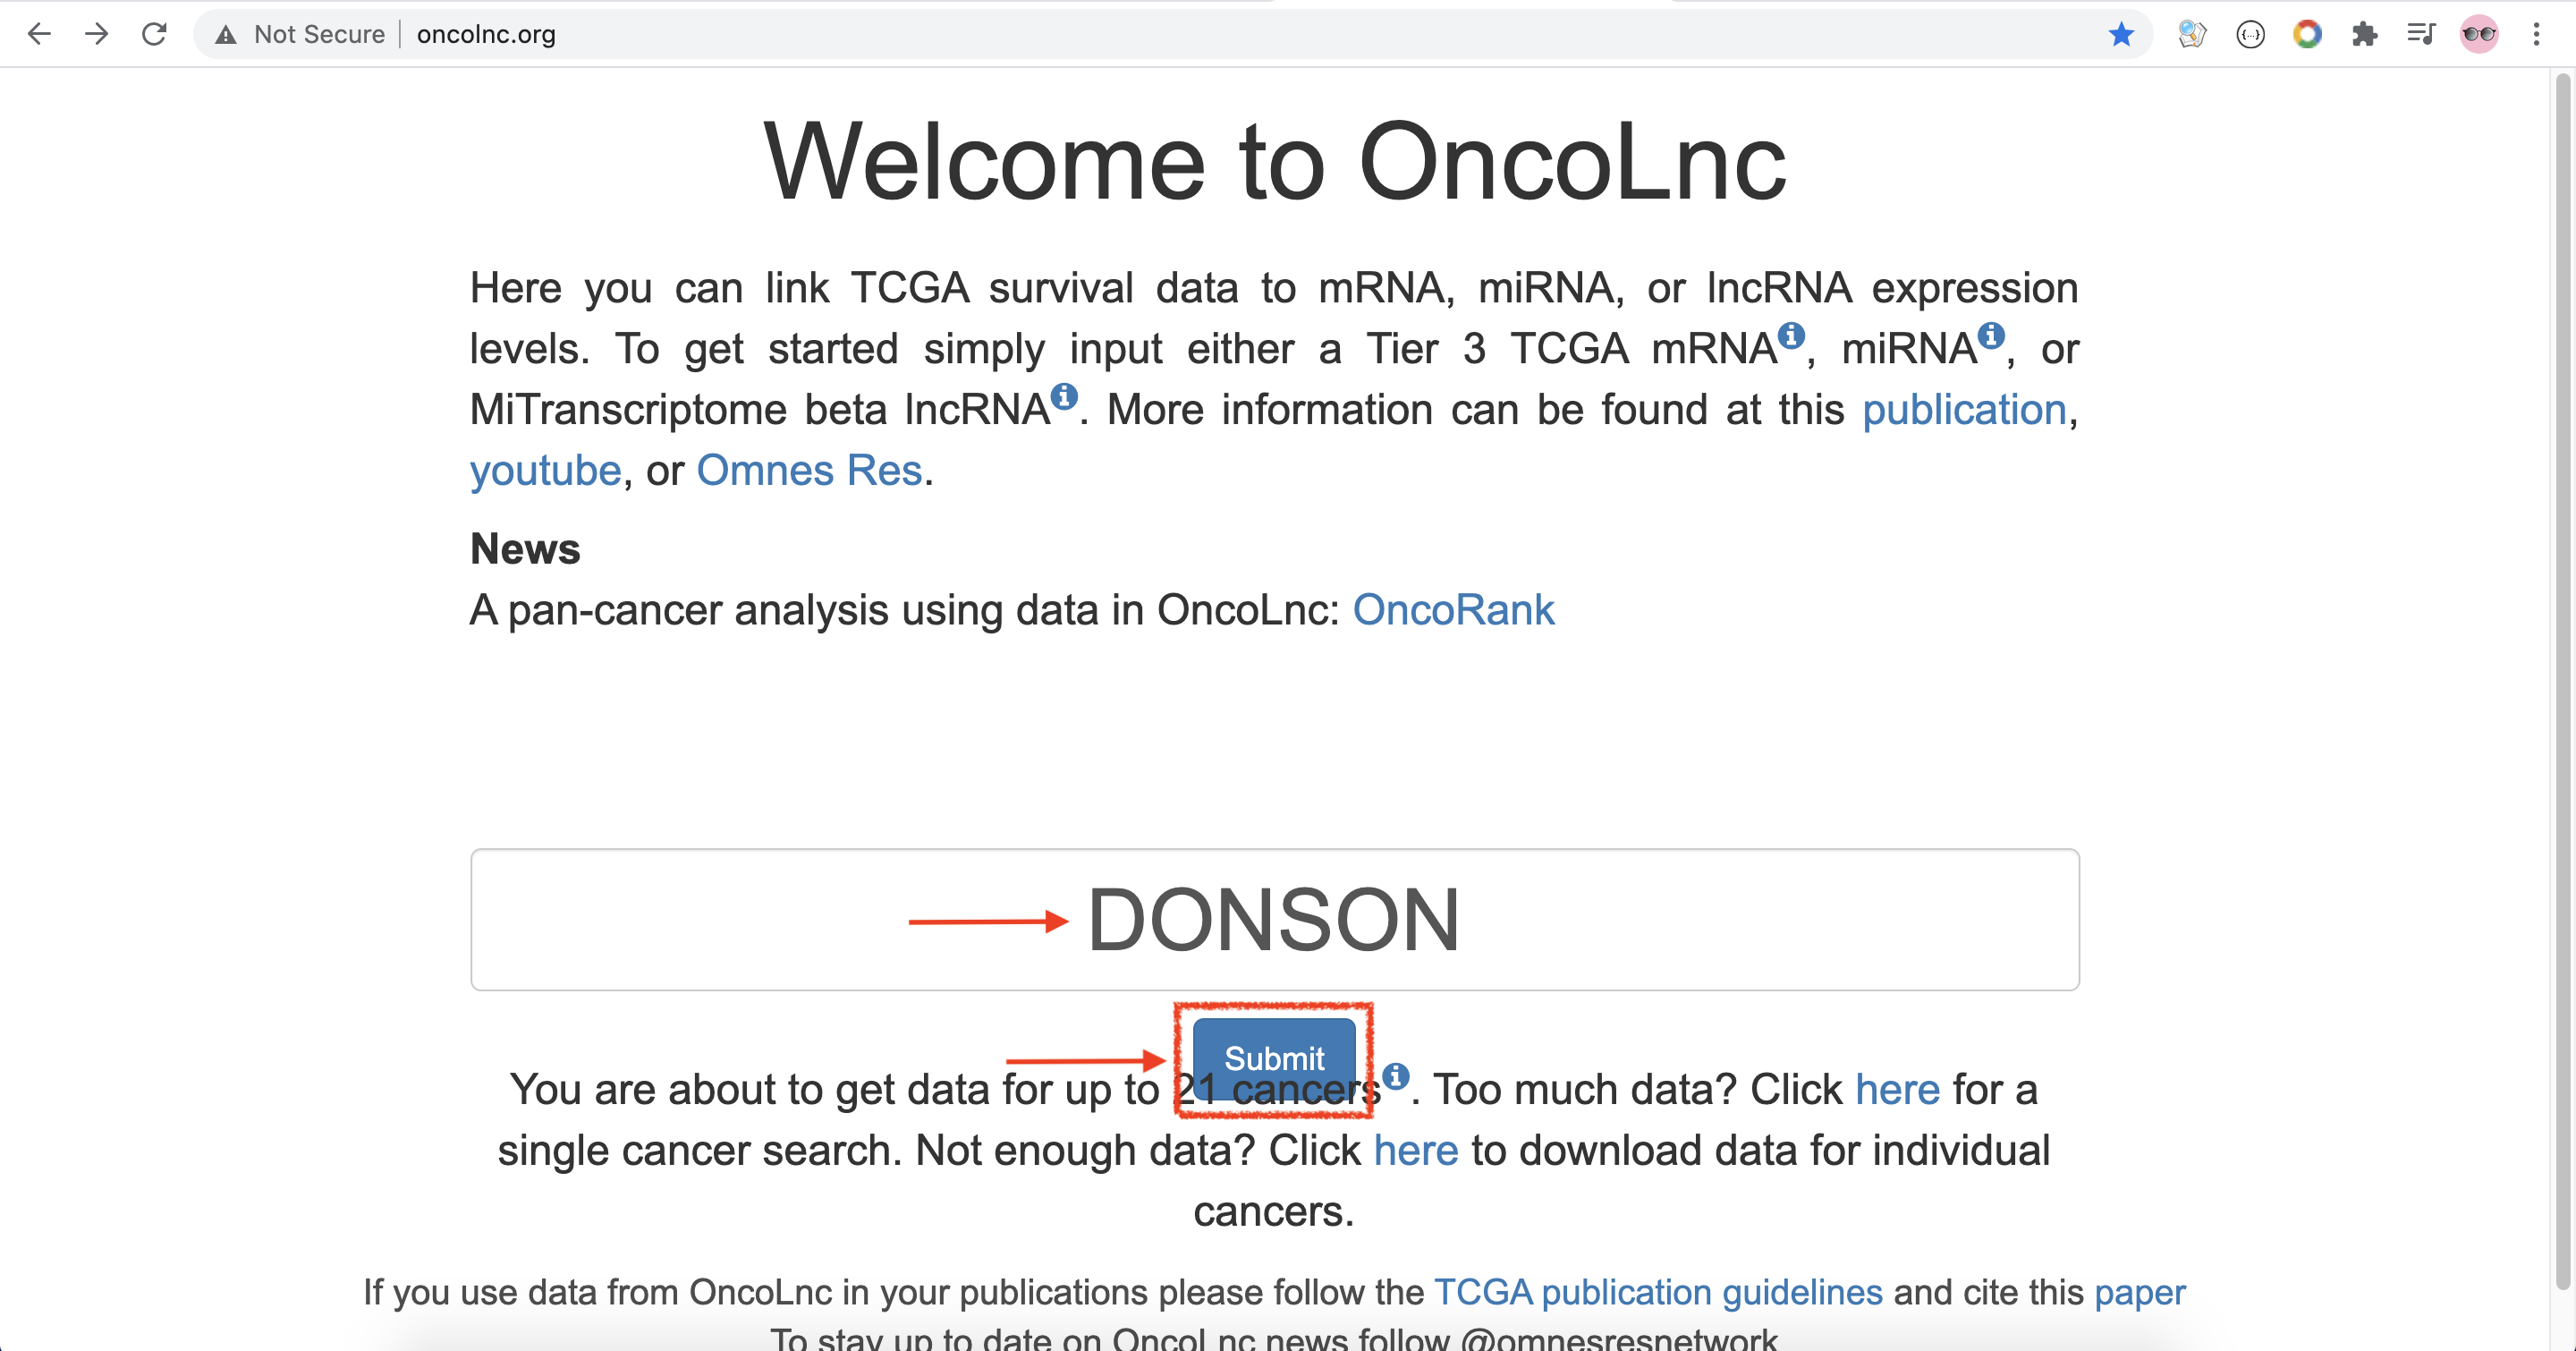
- Enter Interested Gene, DONSON, and click on
Submit.
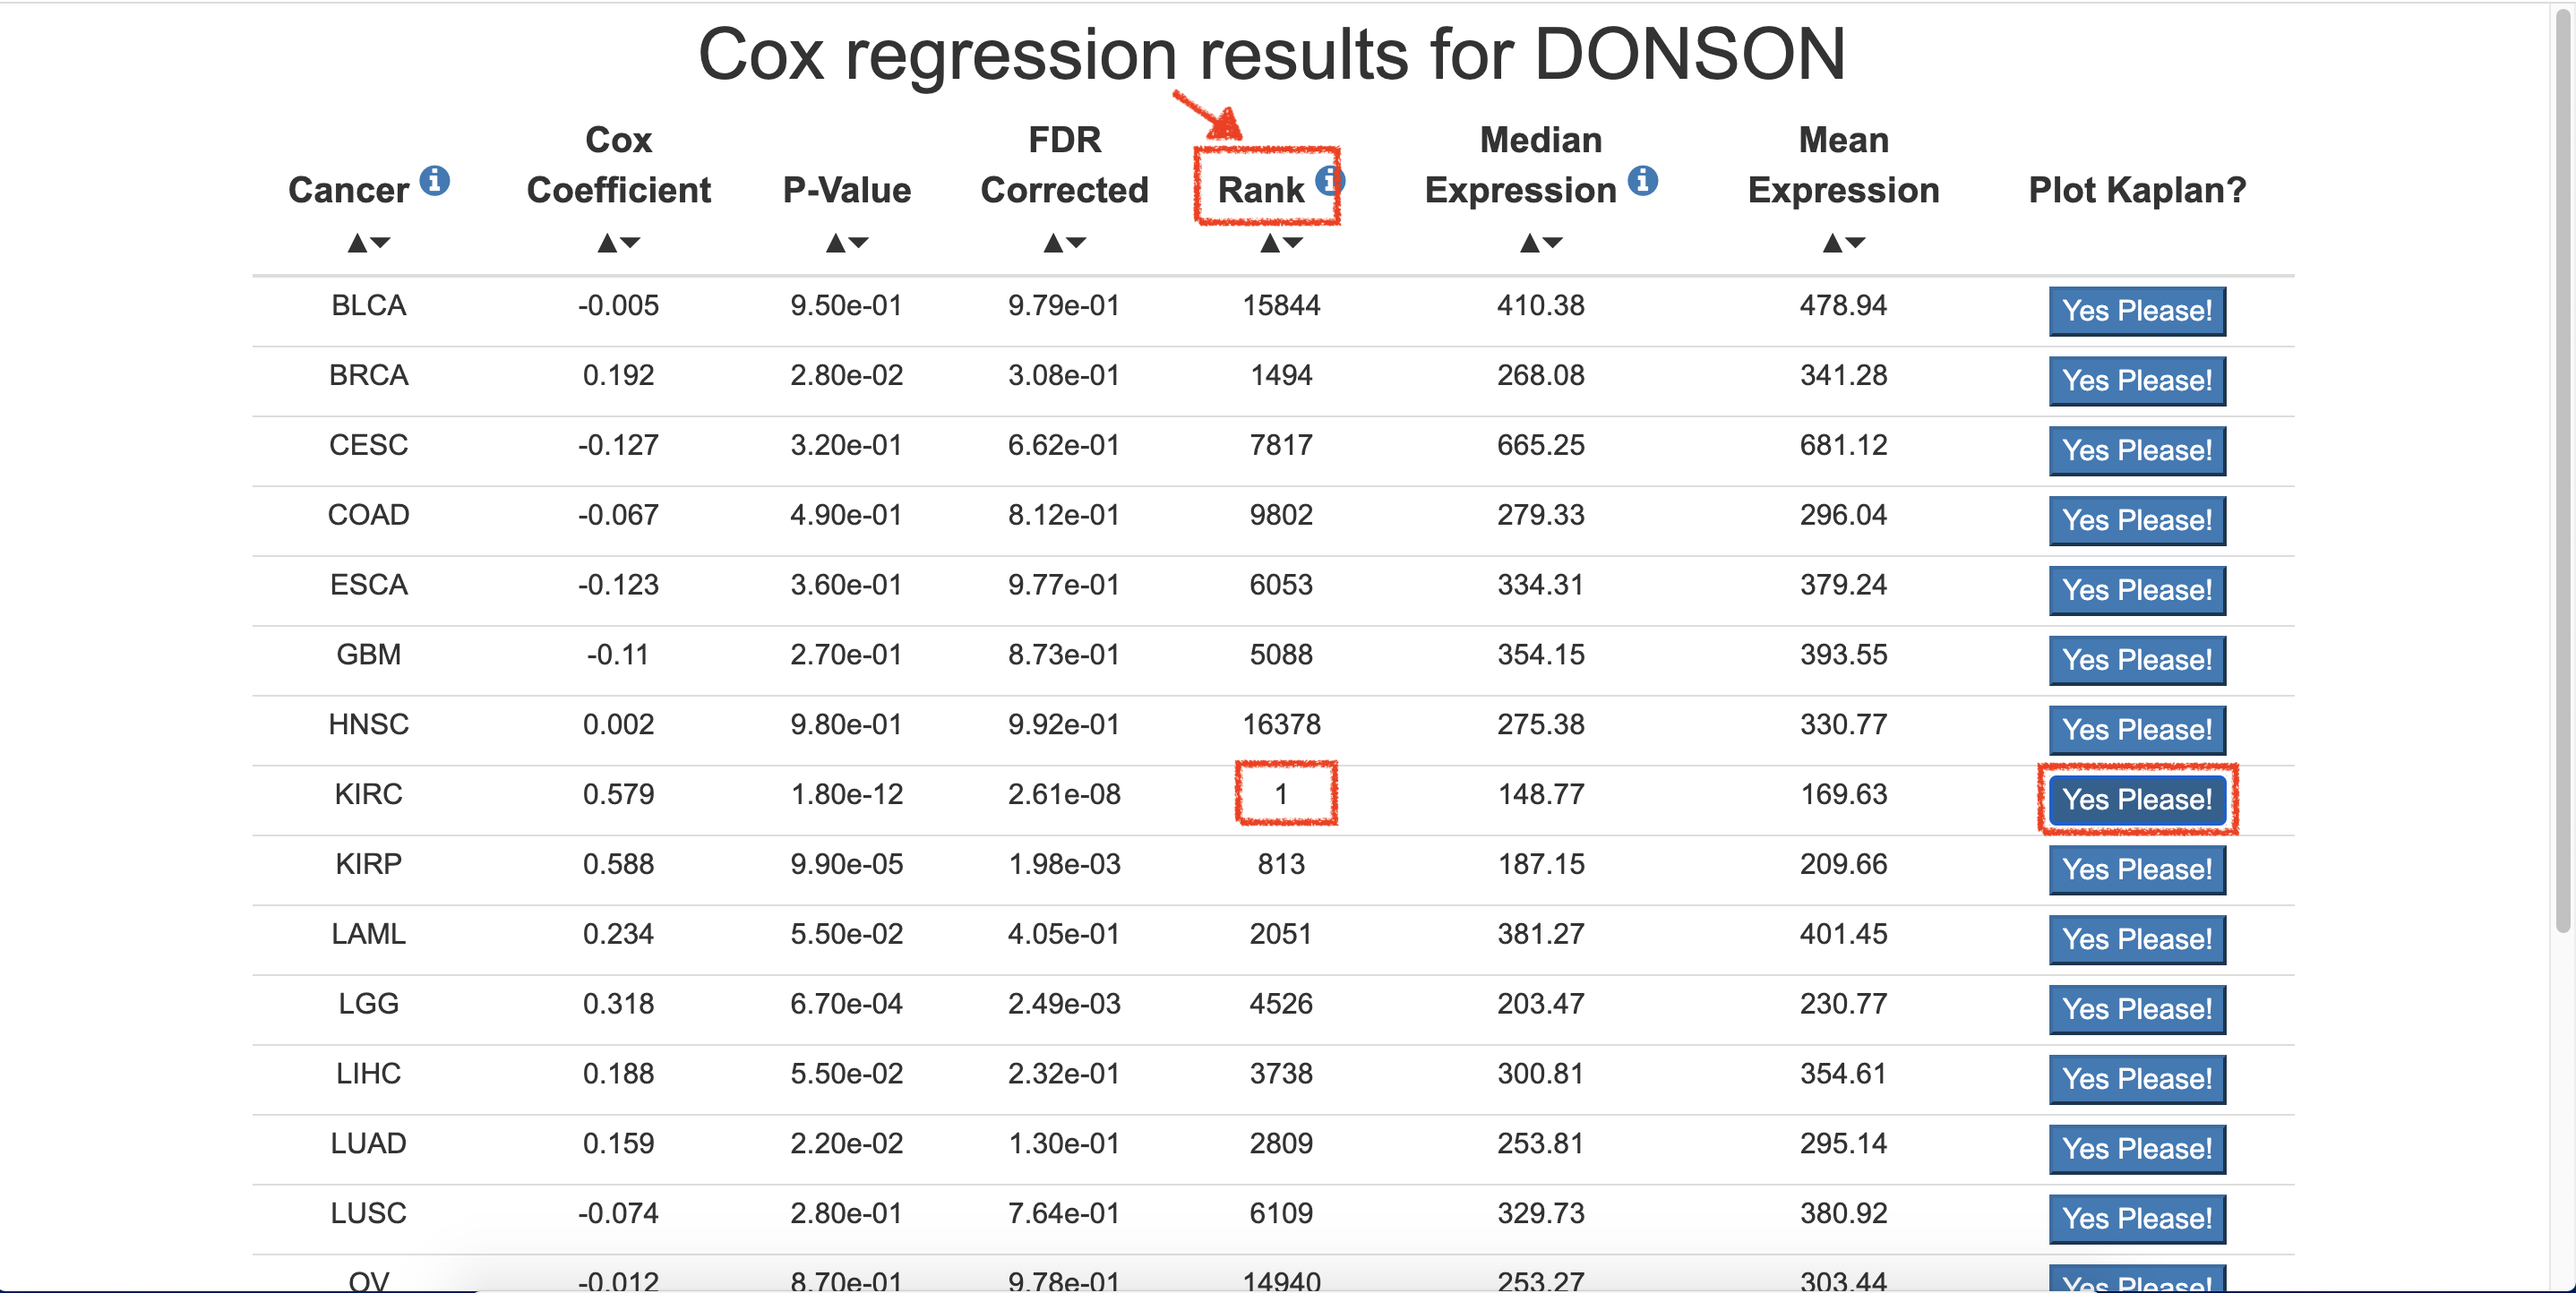
- Choose Interested cancer, KIRC, and click on Yes Please! of the cancer. Herein, DONSON gene ranked in #1.
-
Setup value for Lower Percentile and Upper Percentile with the purpose of dividing the patients without overlapping slices.
-
Click on Submit.
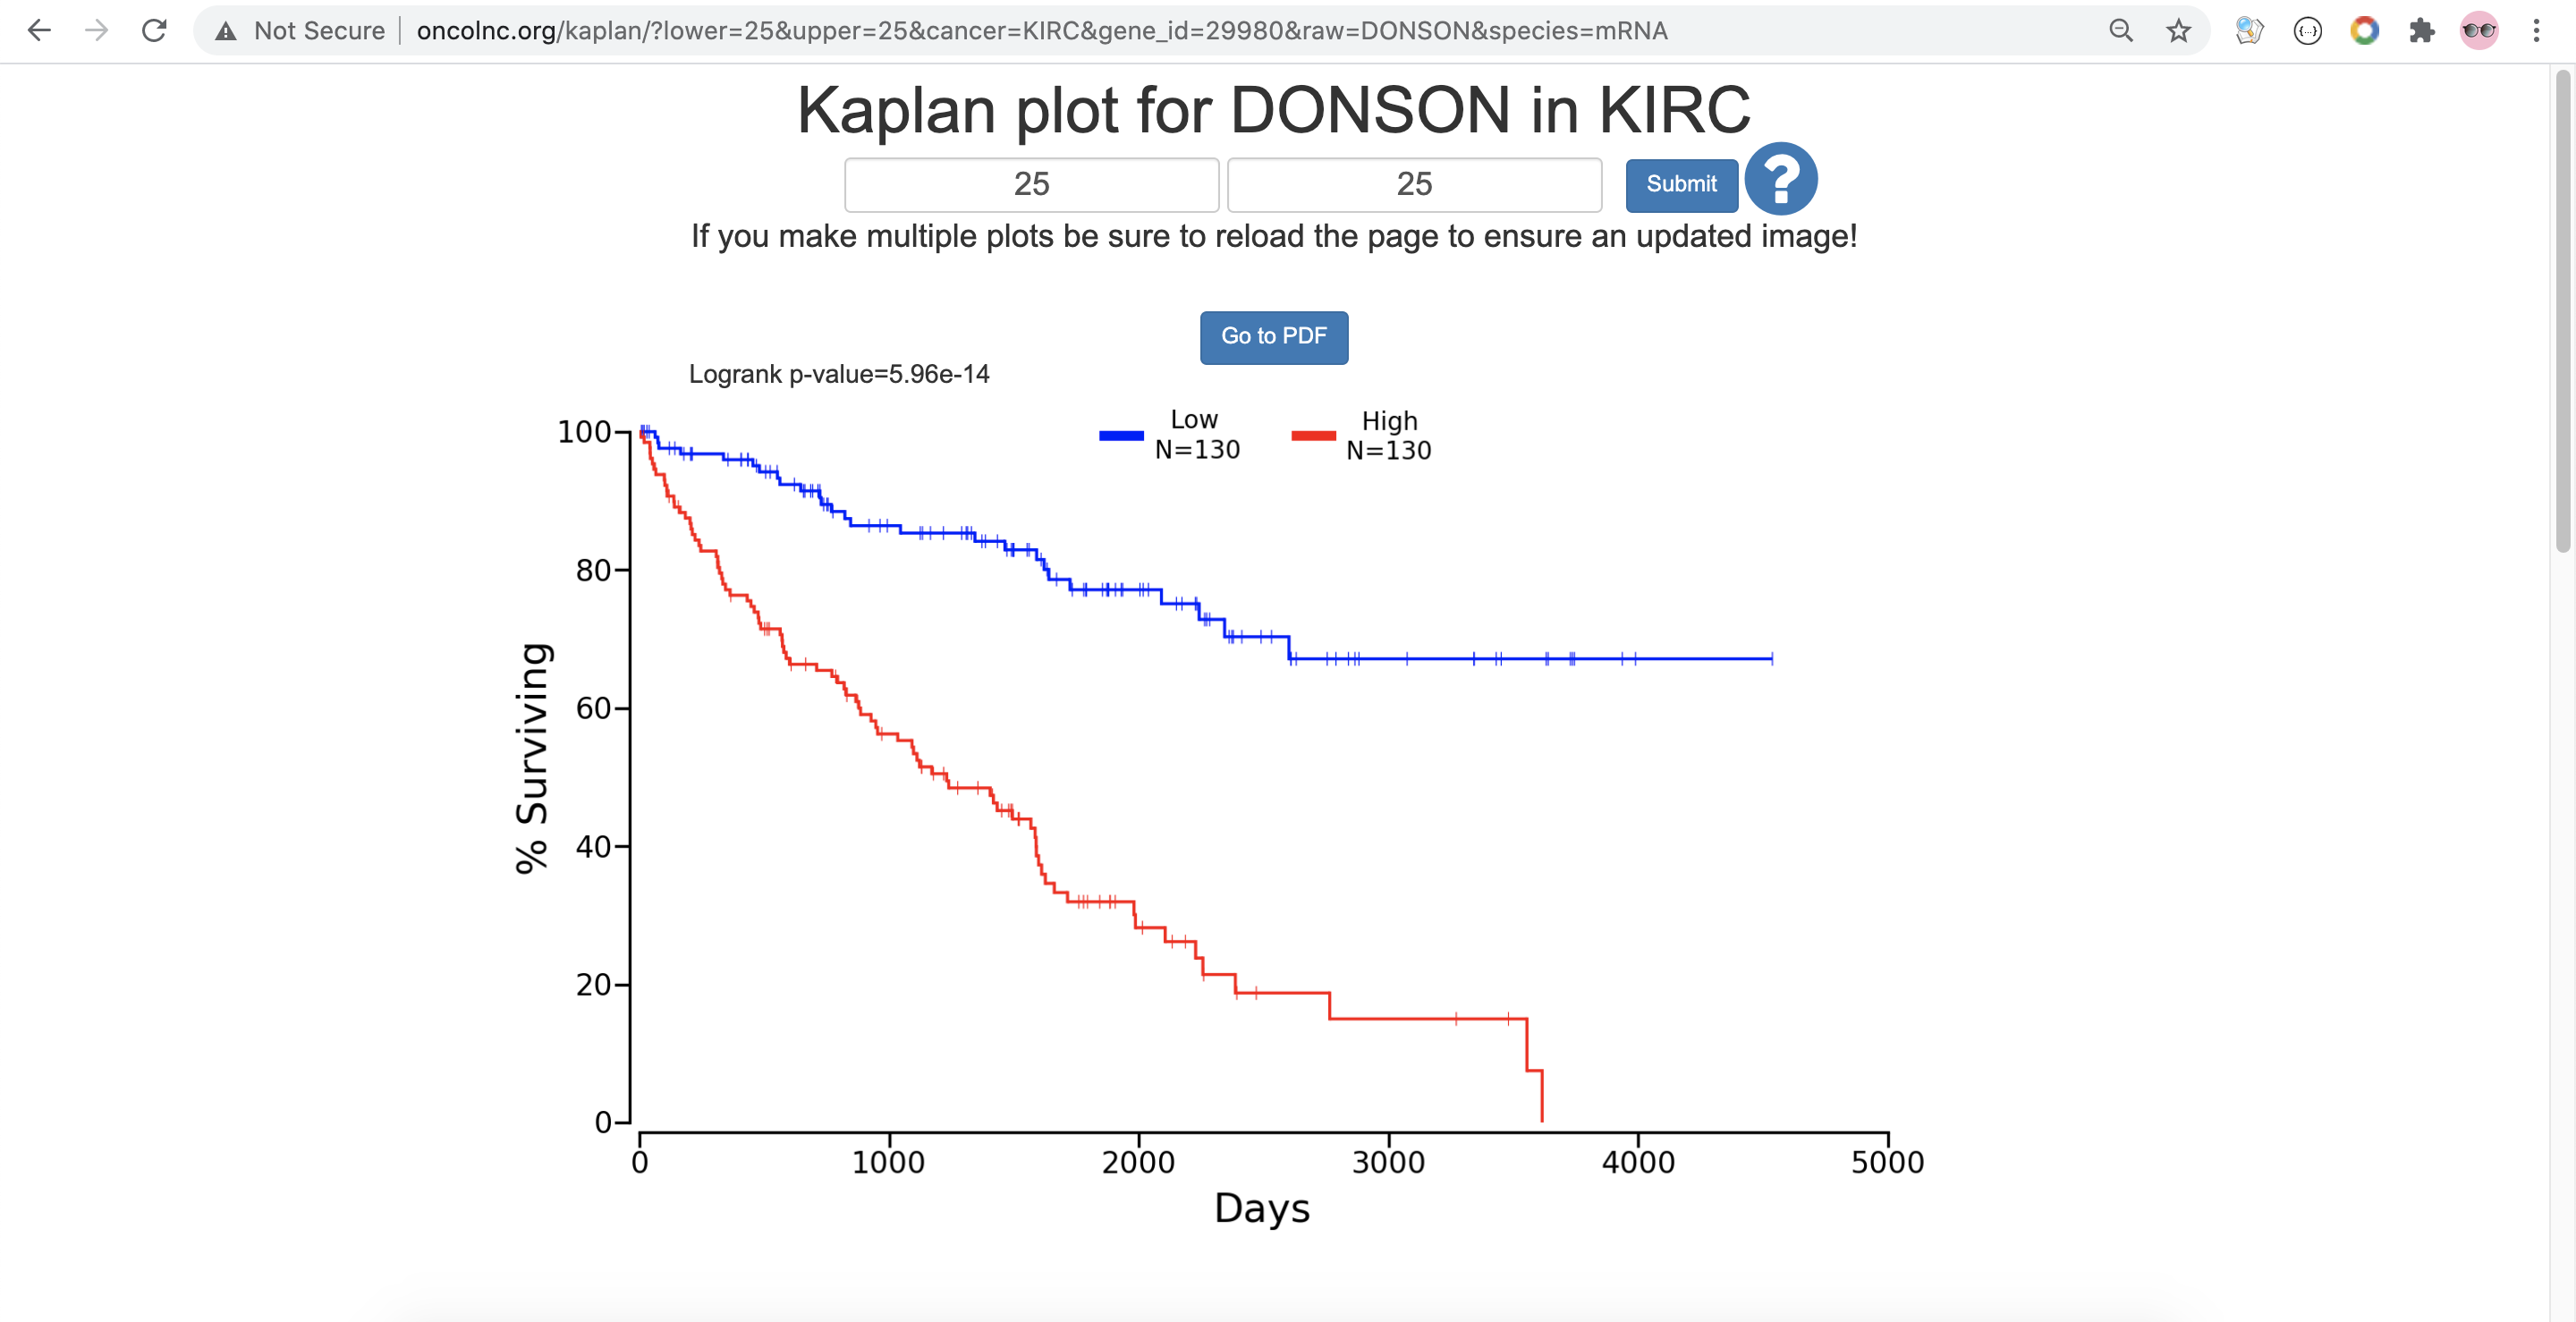
- Click on Click Here, to get the excel file of this data.
Re-analysis with R
Reading Data and Check Basic Information
|
|
Load Packages/Library and Make Basic Plot
|
|
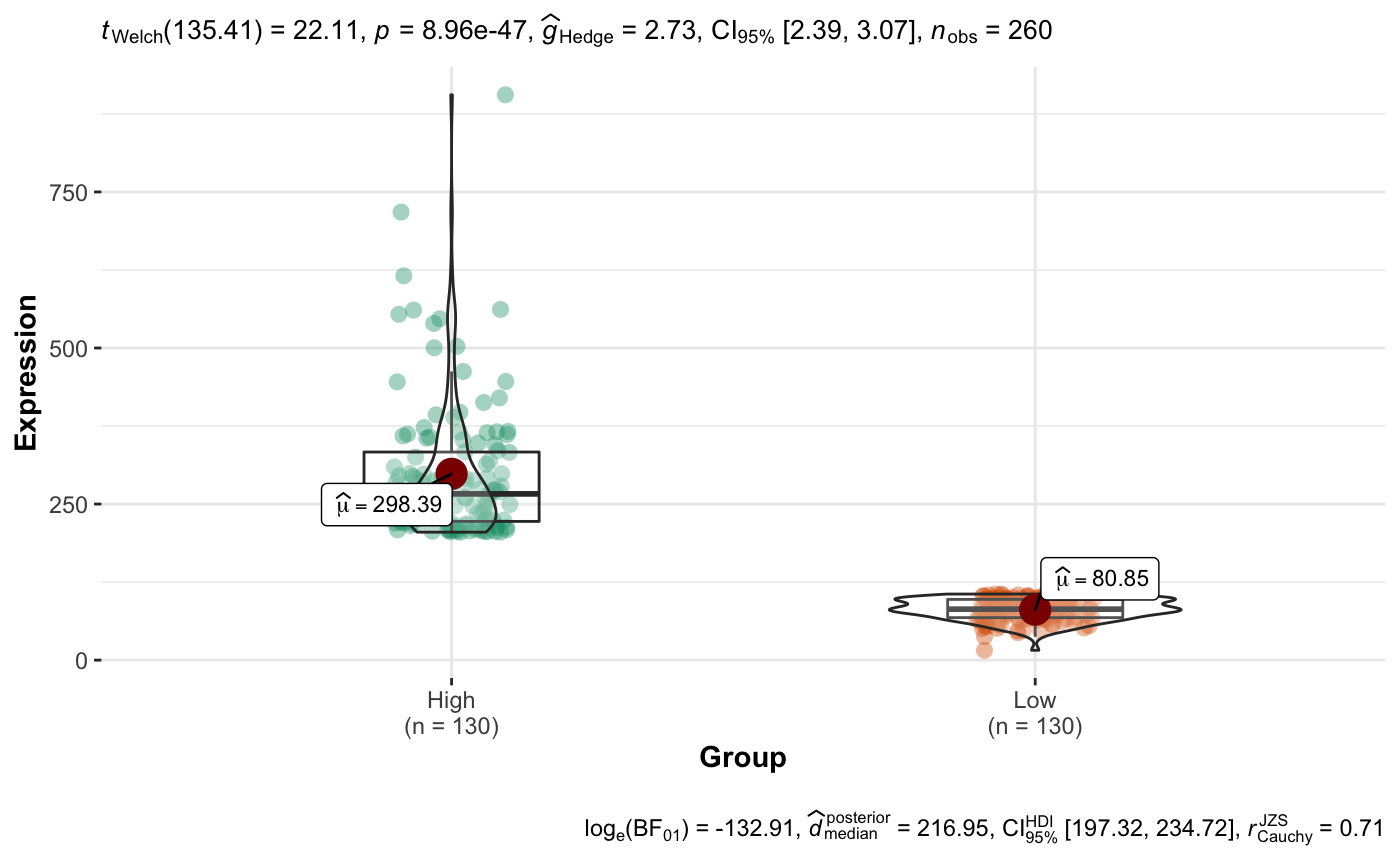
Expression vs Group
|
|
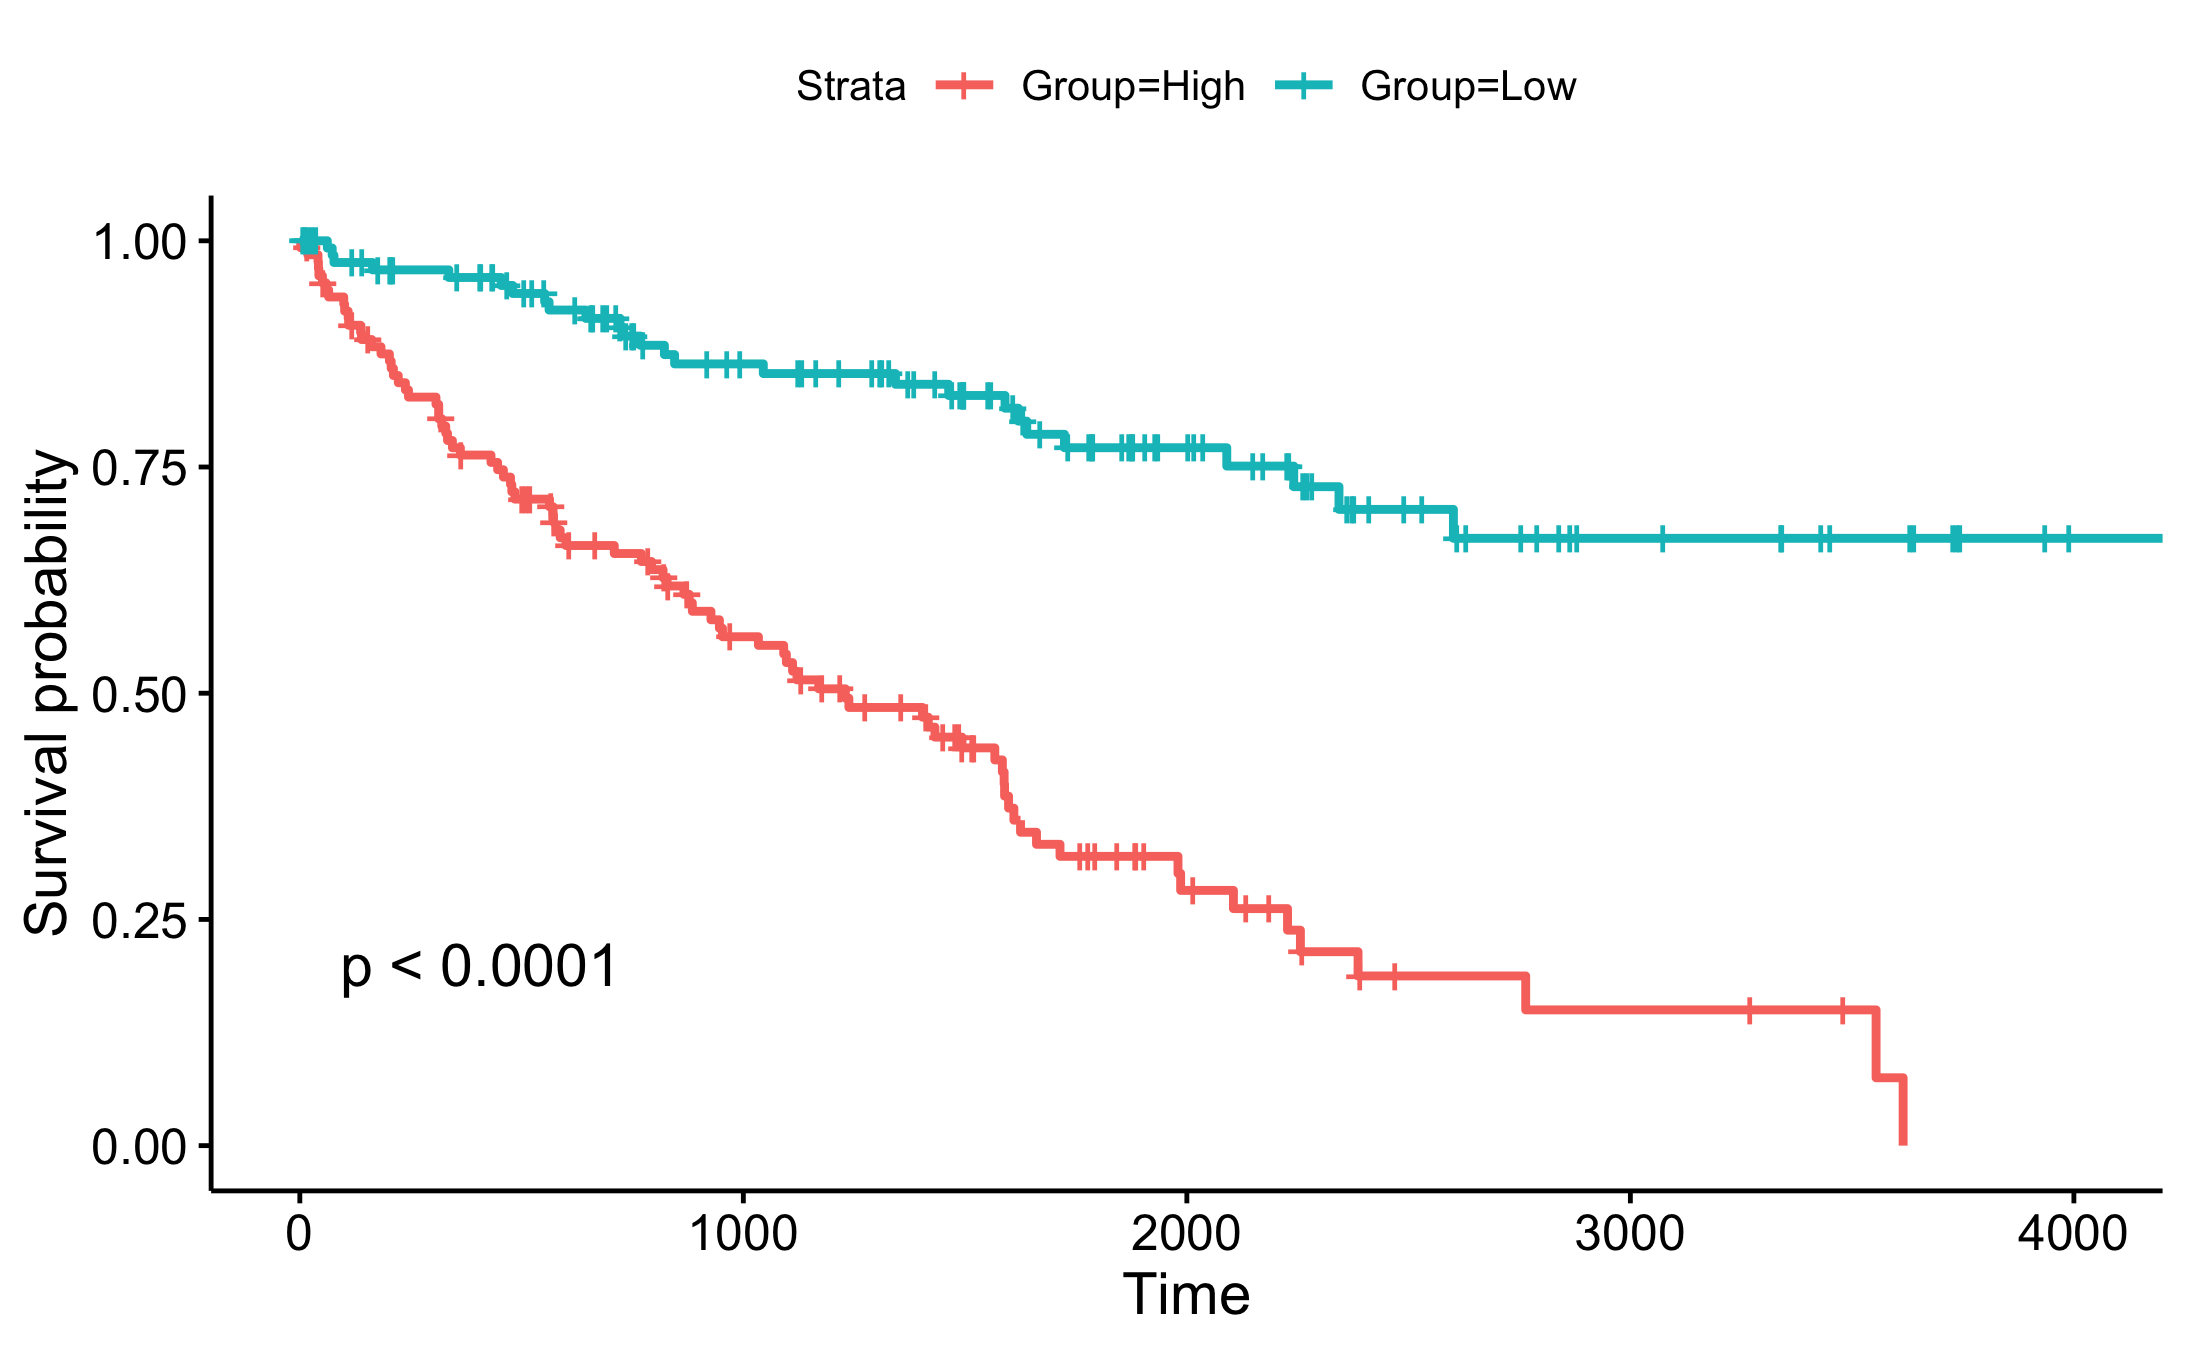
Basic Survival Curve
|
|
Survival Curve With More Information In Figure
|
|
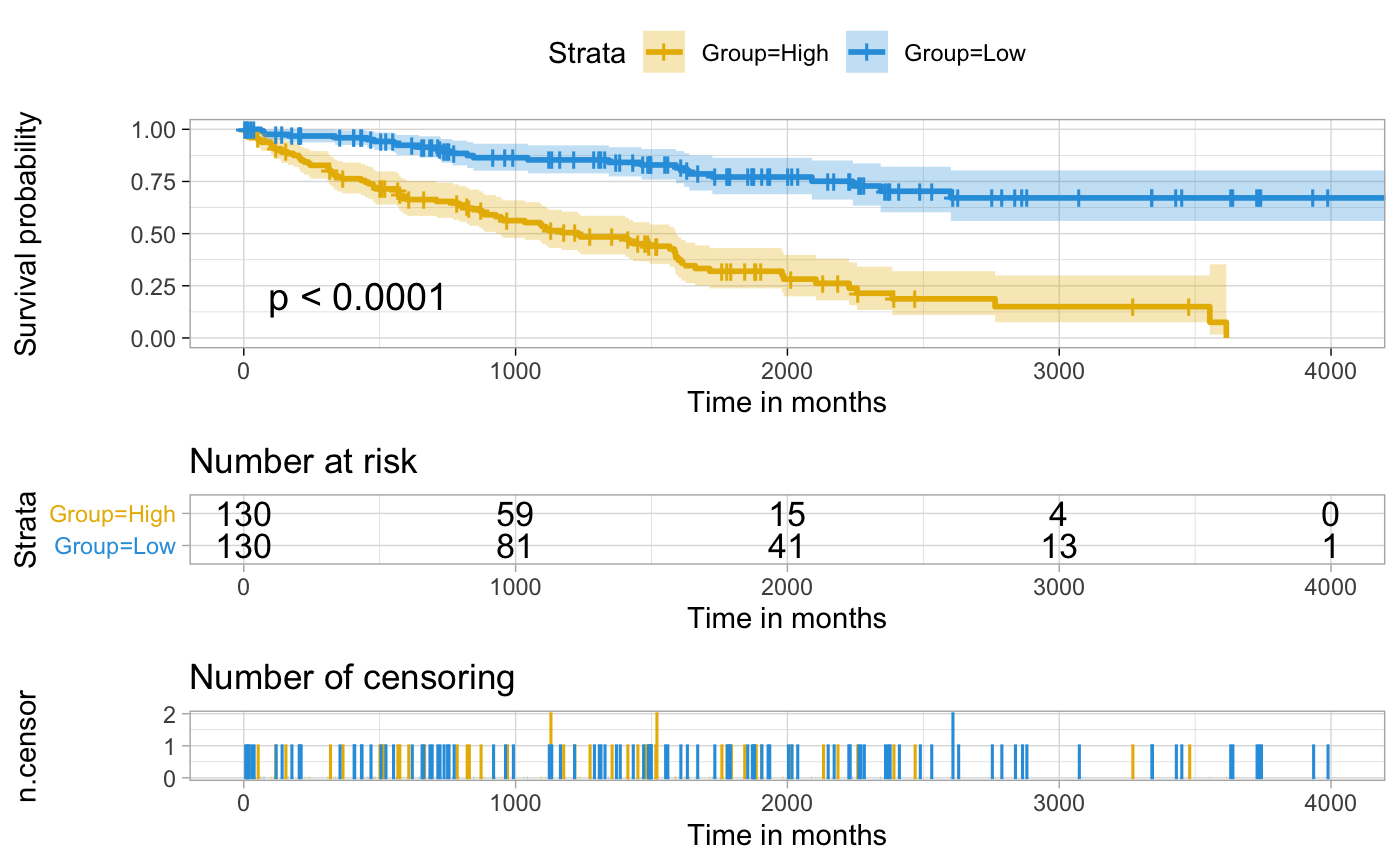
Herein, R.script is reused to make survival curves.
Summary
Overall
-
The code was run with Python 2.7.5, NumPy 1.7.1, and rpy2 2.5.6.
-
It can require upwards of 6GB of RAM.
-
OncoLnc runs on Django 1.8.2, Python 2.7, matplotlib 1.2.1, NumPy 1.7.1, rpy2 2.5.6, uses the SQLite3 database engine, and utilizes Bootstrap CSS and JavaScript, and Font Awesome icons.
Reproduce information
-
Put the expression files to the correct locations.
-
Run the desired Cox regressions.
-
Go to the cancer of interest and run the cox_regression.py file from the command line.