1
2
3
4
5
6
7
8
9
10
11
12
13
14
15
16
17
18
19
20
21
22
23
24
25
26
27
28
29
30
31
32
33
34
35
36
37
38
39
40
41
42
43
44
45
46
47
48
49
50
51
52
53
54
55
56
57
58
59
60
61
62
63
64
65
66
67
68
69
70
71
72
73
74
75
76
77
78
79
80
81
82
83
84
85
86
87
88
89
90
91
92
93
94
95
96
97
98
99
100
101
102
103
104
105
106
107
108
109
110
111
112
113
114
115
116
|
#log2()
dat_expr <- log2(dat_expr+1)
phenoDat <- pData(eSet)
head(phenoDat[,1:4])
colnames(phenoDat)
table(phenoDat$`cell type:ch1`)
#filter only Adenocarcinoma
pd <- phenoDat[phenoDat$`cell type:ch1` =='Adenocarcinoma',]
colnames(pd)
pd = pd[,c(2,40,41)]
# rename colnames
colnames(pd) = c('id','time','event')
meta = pd # survival information
head(meta)
dat_expr = as.data.frame(dat_expr)
exp = dat_expr[,colnames(dat_expr) %in% pd$id] # with "geo_accession" and "probe_id"
GPL=eSet@annotation
# convert gene symbol and probe_id
if(F){
if(!require(hgu133plus2.db))BiocManager::install("hgu133plus2.db")
library(hgu133plus2.db)
ls("package:hgu133plus2.db")
ids <- toTable(hgu133plus2SYMBOL)
head(ids)
}else if(F){
getGEO(GPL)
ids = data.table::fread(paste0(GPL,".soft"),header = T,skip = "ID",data.table = F)
ids = ids[c("ID","Gene Symbol"),]
colnames(ids) = c("probe_id")
}else if(T){
ids = idmap(GPL,type = "bioc")
}
head(ids)
probes_anno=ids
head(probes_anno)
# Filter expression matrix based on annotation
# and remove the duplicated gene symbols
genes_exp <- filterEM(exp,probes_anno)
## ======================Check up interested genes======================
head(genes_exp)
genes_exp['PCDH7',]
genes_exp['GJA1',]
## Extract and save
mat=genes_exp[c('GJA1','PCDH7'),] #expression information
save(mat,meta,file = 'input_for_survial.Rdata')
list.files()
## ======================Analysis results============================
rm(list = ls())
options(stringsAsFactors = F)
library(survival)
library(survminer)
load(file = 'input_for_survial.Rdata')
identical(colnames(mat),rownames(meta))
e=cbind(meta,t(mat))
head(e)
e$time = as.numeric(e$time)
e$event = as.numeric(e$event)
str(e)
colnames(e)
# Determine the optimal cutpoint for each variable using 'maxstat.'
tmp.cut <- surv_cutpoint(
e,
time = "time",
event = "event",
variables = c('GJA1','PCDH7')
)
summary(tmp.cut)
plot(tmp.cut, "GJA1", palette = "npg")
# Divide each variable values based on the cutpoint returned by surv_cutpoint().
tmp.cat <- surv_categorize(tmp.cut, labels = c("low","high"))
head(tmp.cat)
table(tmp.cat[,3:4])
kp=tmp.cat$GJA1 == tmp.cat$PCDH7
table(kp)
tmp.cat=tmp.cat[kp,]
#plot
library(survival)
fit <- survfit(Surv(time, event) ~ GJA1+PCDH7,data = tmp.cat)
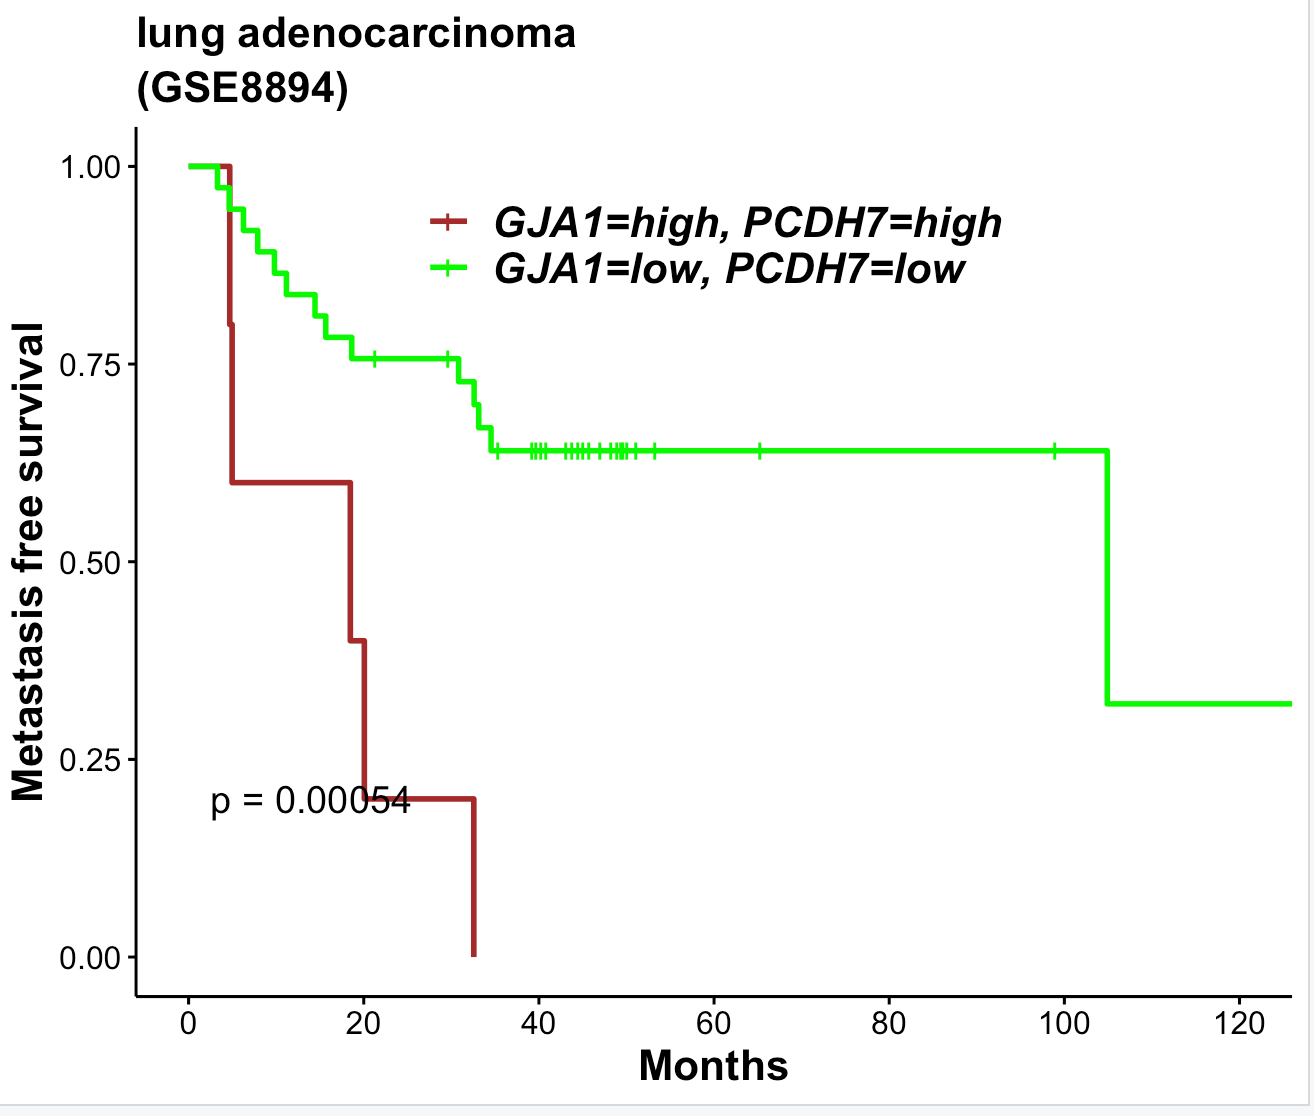
ggsurvplot(
fit,
palette = c("brown", "green"),
pval = TRUE,
conf.int = FALSE,
xlim = c(0,120),
break.time.by = 20,
legend=c(0.5, 0.9),
legend.title = '',
font.legend = c(16, "bold.italic", "black"),
risk.table.y.text.col = T,
risk.table.y.text = FALSE,
xlab = "Months",
ylab = "Metastasis free survival",
font.x = c(16, "bold", "black"),
font.y = c(16, "bold", "black"),
font.title = c(16, "bold", "black"),
font.subtitle = c(16, "bold", "black"),
title = "lung adenocarcinoma",
subtitle = "(GSE8894)"
)
|