Colab is an interactive notebook provided by Google (primarily) for writing and running Python through a browser.
Then, how to use R in Google Colab?
There are two ways to run R in Colab
-
The first way is to use the
rpy2package in the Python runtime. This method allows you to execute R and Python syntax together. -
The second way is to actually start the notebook in the R runtime.
To use R and Python together in Colab
-
Open google browser.
-
Create a new notebook.
-
Run rmagic by executing this command
%load_ext rpy2.ipython. -
After that, every time you want to use R, add
%%Rin the beginning of each cell.- Start rmagic by executing this in a cell:
1%load_ext rpy2.ipython- Use %%R to execute cell magic
1 2 3%%R x <- seq(0, 2*pi, length.out=50) x- copy R variable to Python:
1x = %R x
Start to use R in Colab
-
Confirm that you are in the R runtime by going to the “
Runtime” settings, and select “Change runtime type”. -
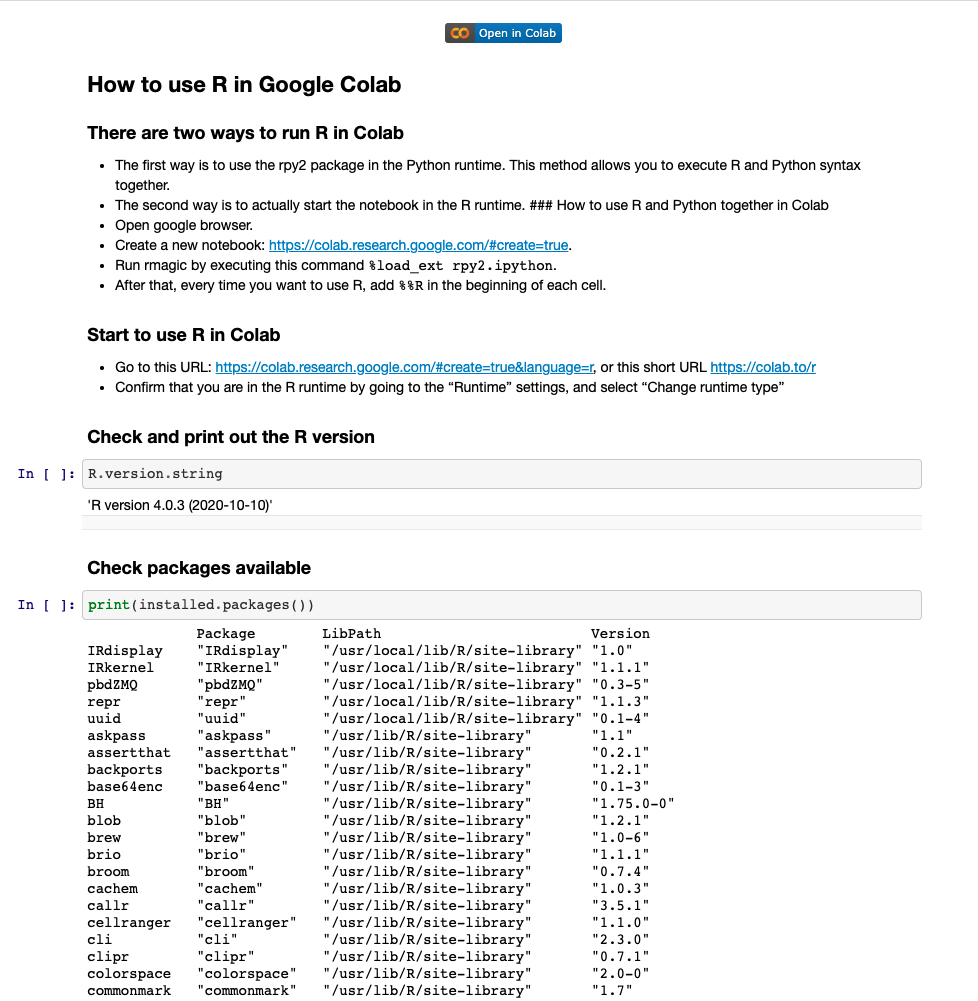
Check and print out the R version
|
|
- Check packages available
|
|
As an example, to install Package esquisse
-
Package esquisse-
Explore and Visualize Your Data Interactively with the ggplot2 package.
-
A ‘shiny’ gadget.
-
To create ‘ggplot2’ charts interactively with drag-and-drop to map your variables.
-
You can quickly visualize your data accordingly to their type, export to ‘PNG’ or ‘PowerPoint’, and retrieve the code to reproduce the chart.
1 2install.packages("esquisse") library(esquisse)
-
Show me the code